Chapter 9 Sharing
This topic covers a variety of ways to share R code with others. The goal is to make your work accessible and reproducible for others. Sharing can take many forms, including sharing your RStudio project, creating a distilled version of your analysis that others can follow, developing a web-based application for others to use, or finding ways to contain and disseminate reproducible analyses. By sharing your work, you enable others to learn from and build upon your research, making it more impactful and useful for the wider community.
 |
At the end of this chapter you should be able to
|
9.1 Reproducibility and Data Science Notebooks
The ability to reproduce or replicate published scientific findings is a critical component to the scientific process. However, over the last decade, the ongoing “reproducibility/replication crisis” has emerged with the problematic concern that many research findings cannot be reproduced.
In the context of data analysis, irreproducibility can occur for a varitey of reasons including:
- raw data not provided
- analysis files or scripts not provided
- analysis methods not adequately described
- wrong analysis methods used
- software, analysis scripting bugs
In recent years, publication standard have increased to help combat the reproducibility crisis. For example, many journals now require that raw data be included in the publication process. As scientists, it is also important for us to keep reproducibility in mind as we perform data analysis tasks. Not only does this help us to conduct better science, reproducible analysis methods can also make our jobs easier by clarifying the analysis process and explicitly capturing all steps that were performed.
Reproducible data analysis aims to ensure that someone else is able to repeat the analysis and get the same results. This “someone else” could also be you in the future! A reproducible analysis should provide the why behind the methods used (i.e. good documentation) and the how/what was done (i.e. input data and analysis code). Each analysis step should be explicit and clear, and provide the foundation for others to understand and evaluate what was done.
It’s important to note that reproducibility does not imply correctness. You can still do the wrong thing (i.e. apply incorrect methods or have a bug in your code) in a reproducible way. However, knowing exactly what was done is critical to finding and correcting mistakes. Reproducible methods also enables you to more easily share your work and allow others to help find and fix problems.
Reproducibility in data analysis exists at many different levels, including:
- reproducibility of your own processes and code
- does your code capture all steps of the analysis?
- if you make changes to your code, could you revisit older versions?
- reproducibility of external code (software versions, packages, libraries)
- is your analysis reproducible if you upgrade your software?
- could you access older software versions if you needed to?
- reproducibility of your compute environment
- what happens if you upgrade your computer?
- is your analysis affected by different operating systems or settings?
- reproducibility of your data
- could the analysis data change in the future, knowingly or unknowingly?
- could you detect a change in the data if one occurred?
Whether or not an analysis is fully reproducible isn’t a binary assessment. There is a continuum along the reproducibility scale, and not all projects require the same level of reproducibility. A high degree of reproducibility can require a significant amount of time and cost, so one must balance this effort with the needs of the project.
Fortunately, a basic but highly effective level of reproducibility in data analysis tasks can be achieved by following a few guidelines:
- Capture all steps of an analysis in code/scripts/analysis notebooks, starting from reading input data through to the final output of results.
- Avoid any manual editing or transformation of data.
- Provide good documentation about the why behind the analysis and the choices you made
- Provide how/what you did through your analysis code
To help data analysts follow these guidelines, data science notebooks have emerged as a standard tool used for conducting and communicating analysis work. There are a variety of notebook formats to choose from, including Jupyter Notebooks, RMarkdown and Quarto, but they all generally use a literate programming style where code and documentation about the code live in the same document. These notebooks typically utilize two type of “languages”
- Plain text, formatted text, or a Markup language (e.g. Markdown) to capture the documentation
- A programming language to capture the code underlying the analysis
After an analysis notebook has been created, the document can be “compiled” to create a human readble document that combines both the documentation, the code, and the output from the code. The compiled document can exist in a variety of forms (e.g. PDFs or HTML files) that can be easily shared with others who can see exactly how the analysis was performed.
9.2 Quarto
Quarto is a modern “open-source scientific and technical publishing system” created by Posit. For many years, RMarkdown (also developed and supported by Posit/RStudio) was the default data science notebook platform for R users. However, development for RMarkdown was stopped several years ago and efforts are now focused on Quarto, which also supports other languages including Python.
Quarto is an extremely power system that not only allows one to make data science notebooks, but also books, websites, reports and presentations. See the Quarto Gallery for examples of what Quarto can do.
 |
Installing Quarto: Before you can use Quarto in RStudio, you need to first install it. Follow the instructions on the Quarto Get Started page. |
In a Quarto document, you write text documentation and R code in the same text file with a .qmd file extension. RStudio makes it easy to work with Quarto documents, as summarized in the following workflow:
- Create a new .qmd file:
File --> New File --> Quarto Document... - Write/edit the .qmd file using either the source or visual editor
- Once finished, render the file to an output document, such as a PDF or HTML file
You can think of editing a .qmd file just like editing an R script, but with added emphasis on also including well organized text documentation about your methods and accompanying R code. In older versions of RStudio, the only way to edit notebooks (which were RMarkdown notebooks at the time) was to use the source editor, the same one used to edit R scripts. However, RStudio has recently gained the ability to edit .qmd documents using a visual editor. In the source editor, everything, including the text documentation, is written with code. This meant that you had to also learn the markup language Markdown and some HTML to effectively write the text documentation. However, with the addition of the visual editor to RStudio, you can now write text documentation in a text-editor-like manner (e.g. like in Microsoft Word), removing the need to learn additional computer languages.
There are three main components to a .qmd document:
- A YAML header that defines the documention options and parameters
- Text blocks where you document your work, analysis, and code
- Code blocks where write R code to do the actual analysis work
Each of these will be described in more detail in the following sections.
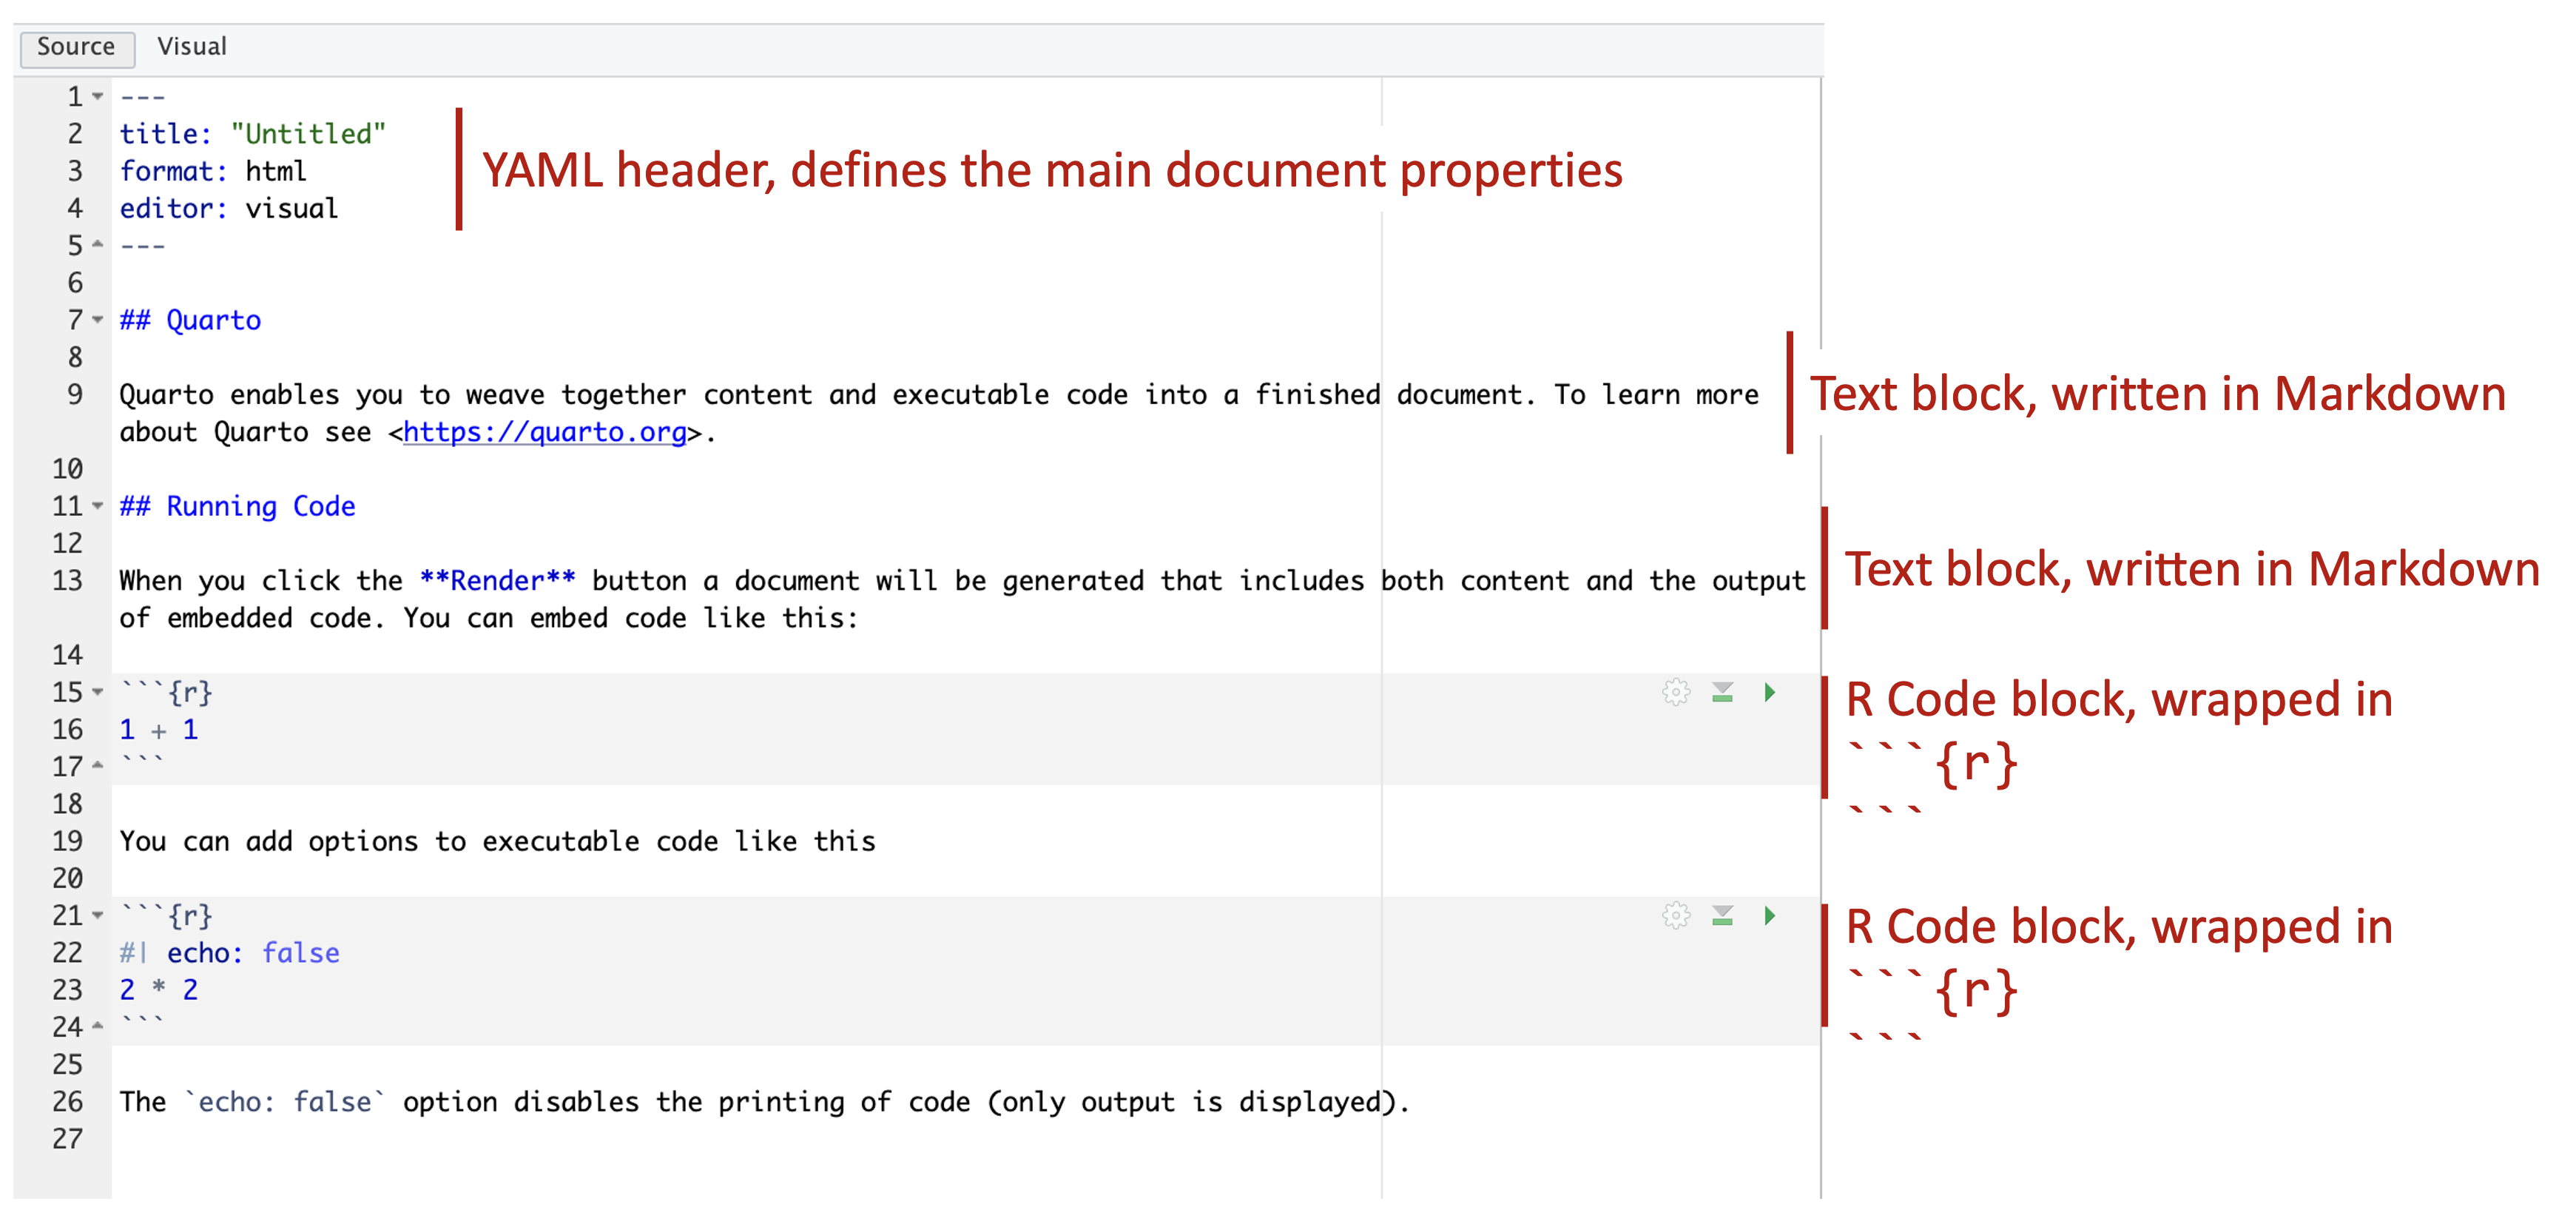
Figure 9.1: Basic components of a Quarto document.
9.2.1 YAML Headers
The YAML header is place at the top of a .qmd file and defines global properties of the document (e.g. title, author, date, output format). While there are a lot of possible options you can specify in the YAML, beginners can just copy and paste the same default template (given below) which covers good default settings for scientific reports.
---
title: "REPORT TITLE"
author: "NAME"
date: "today"
toc: true
format:
  html:
    code-tools: true
    code-fold: true
    self-contained: true
execute:
  echo: true
  warning: false
---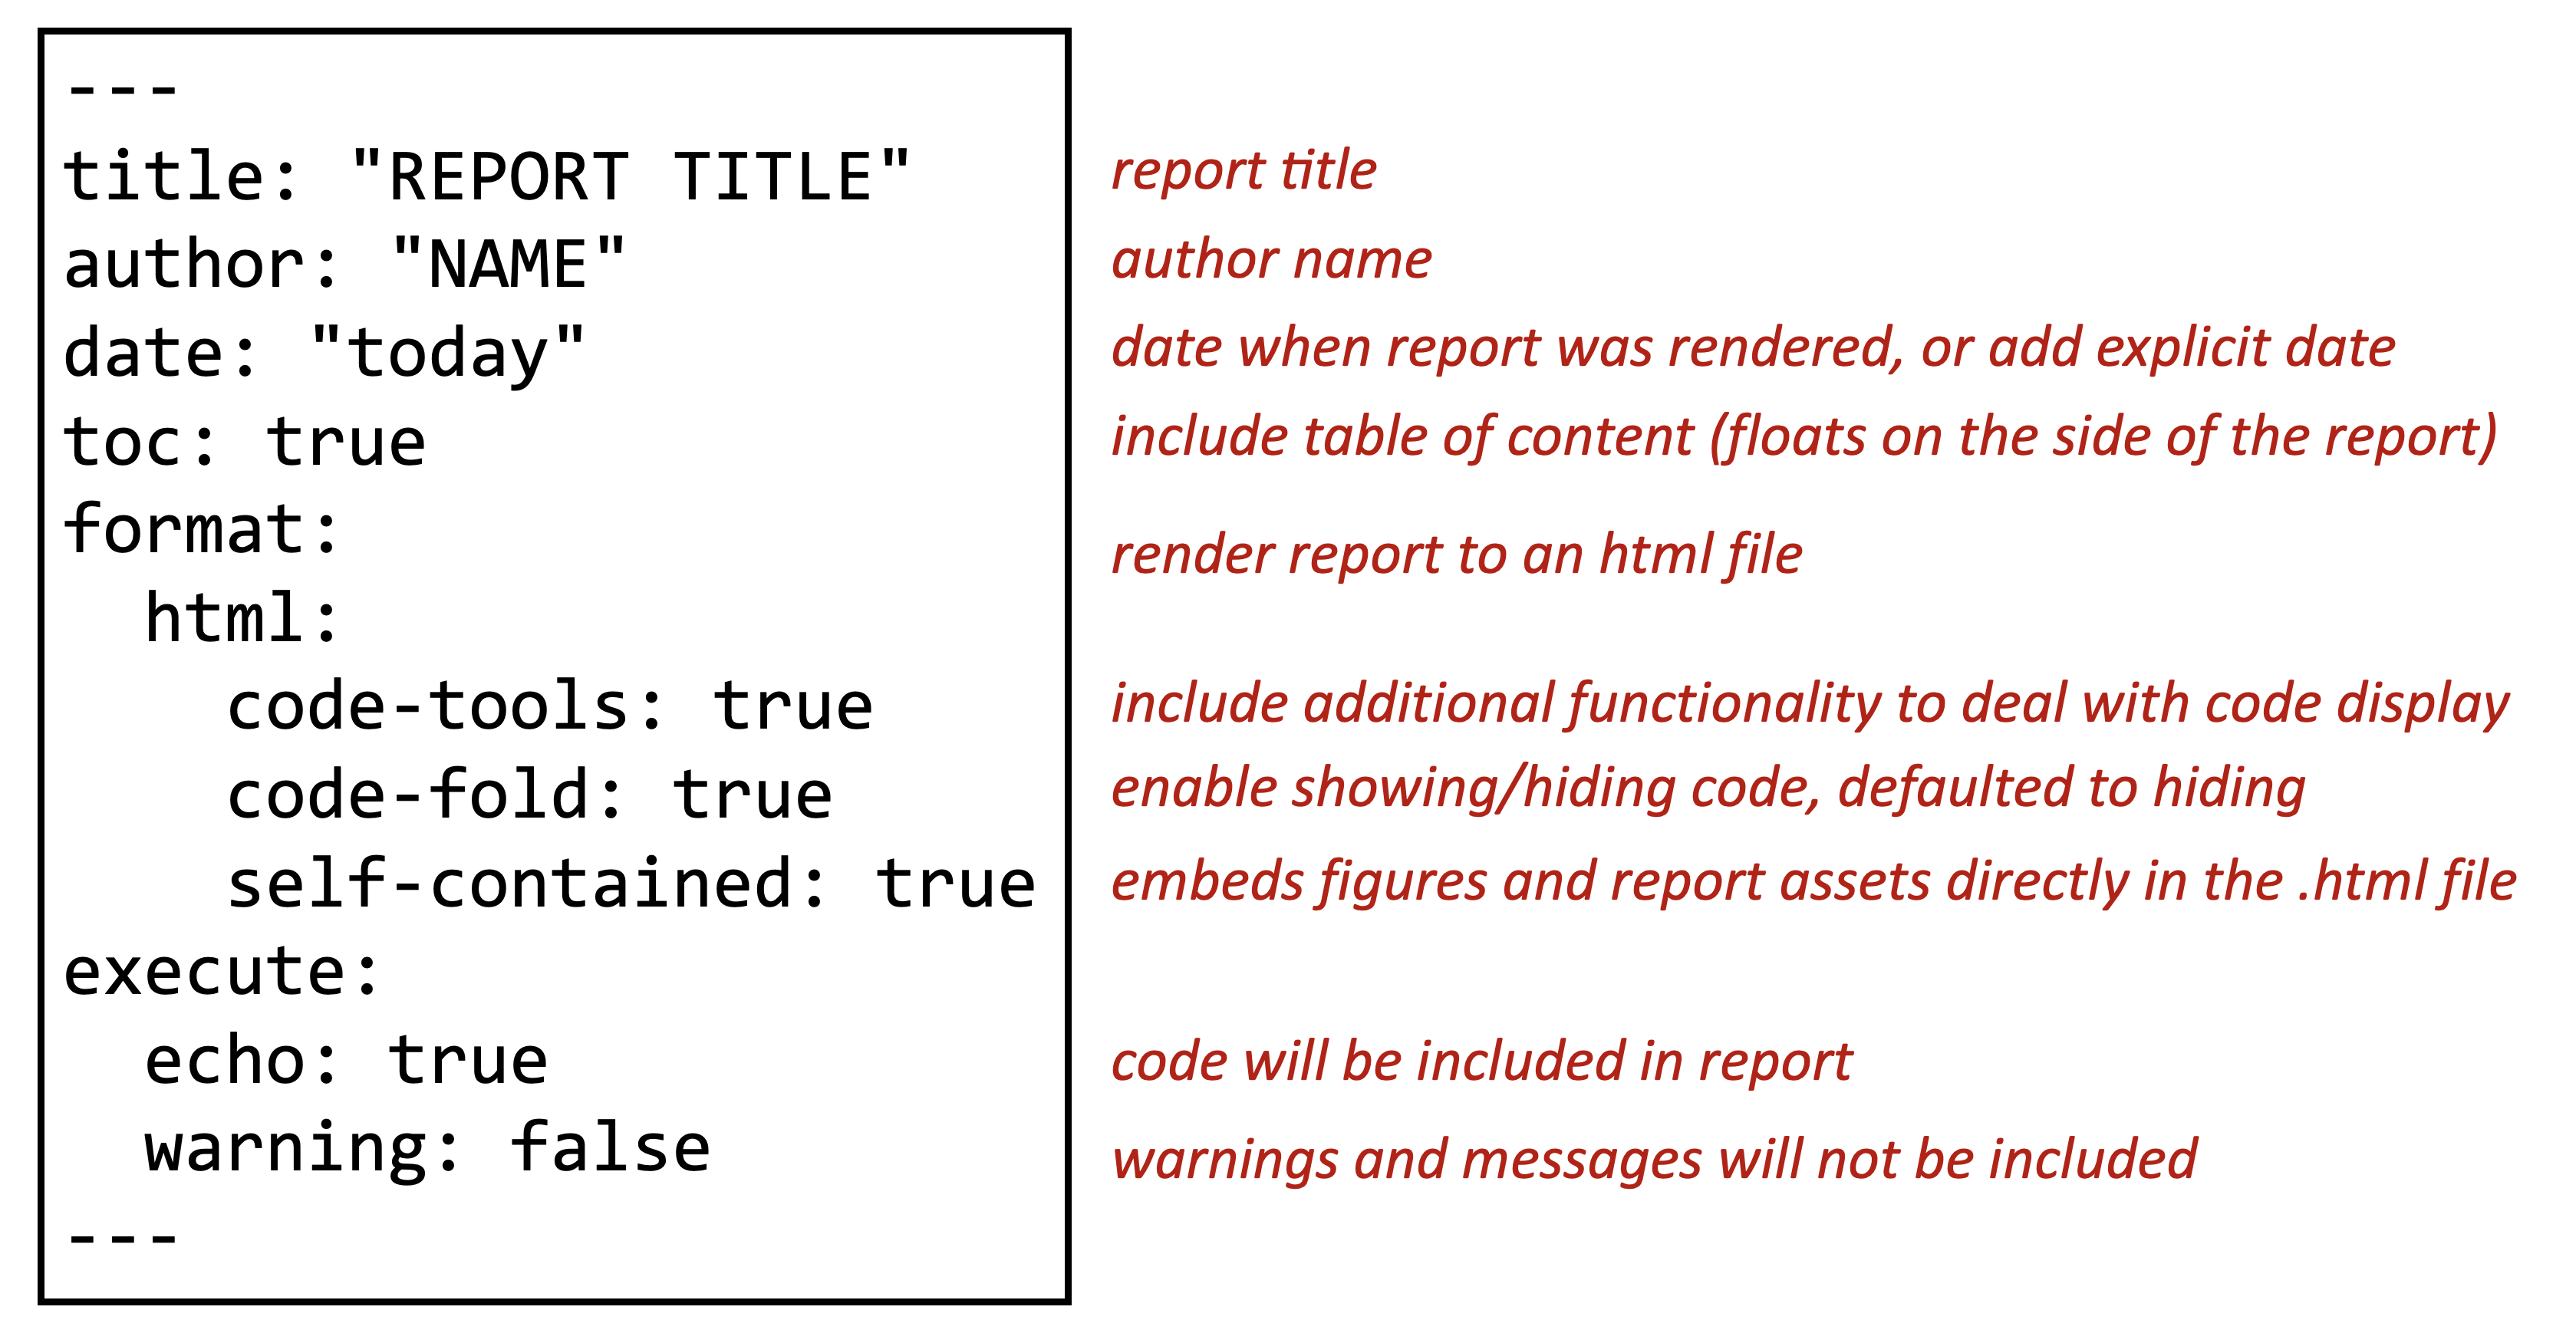
Figure 9.2: Quarto YAML header example.
In the example YAML header above, many of the options are self explanatory: title, author and date are used to specific exactly what they say. In the date option, you can supply a formatted date string (e.g. 2024-06-01), or use the shortcut “today” to insert today’s date (as of the time of rendering the document).
The toc option indicate whether or not you want a table of contents included in the documjent (use false if you don’t).
The format options are a bit more complex, but essentially say that we want HTML output along with some additional options about how code is displayed in the document.
Finally, the execute options specify how the code blocks are handled. In this case, echo: true means we want to include the printing of code in our output document, and warning: false means we want to suppress the printing of R warnings in our ouptut document.
The YAML header content is sandwiched between --- at the top and bottom, with options specified in the middle. These options take the form of a defined keyword (e.g. title), followed by a : and the value that specifies the option. The options supplied in the header are global, meaning they apply to all the following blocks in the document. For example, it’s possible to define default figure size in the YAML header. While you can individually override figure size in each code block, the figure size defined in the YAML will be used by default. There are a lot of options you can configure in the YAML header. But for basic usage, the above header is a great place to start.
9.2.2 Text Blocks
After the YAML header is added, the next step is to intertwine text and code blocks needed to perform the analysis task. There is no limit to the number or length of the text and code blocks: use as many as you need to properly communicate your work. As a shortcut in the visual editor, you can type / on a blank line to bring on an insert palette which provides a list of block types to add to your document, including not only text and code blocks, but also things like bulleted lists, tables and links.
With the visual editor, you can style text using the formatting bar in the editor pane. Furthermore, many standard text editing keyboard shortcuts are also available to use (e.g. CTRL/CMD+B to bold text). When writing text documentation, it is also good practice to make use of heading levels to organize your document by defining sections for your content. By default, the document title (supplied in the YAML header) has the top heading level of 1. Therefore, additional sections in your document should start a level heading 2 and higher. For example, in a report, you may start with a Summary section (heading level 2) which provides an overview of your analysis, information about the input data, and an overview of the methods used. This could be followed with an Analysis section (heading level 2) that goes into the analysis details and code. If you have a more complex analysis, you may further divide the Analysis section into subgroups (heading levels 3) to describe individual components of the analysis. Finally, you may add a Conclusions section (heading level 2) to summarize the main results and findings. How you organize your document is completely up to you, but following standard writing procedures that you use in other contexts (e.g. when writing publications or reports in school) is recommended. As an added benefit, level heading sections are used to automatically generate a table of contents, which can be particularly useful for longer documents.
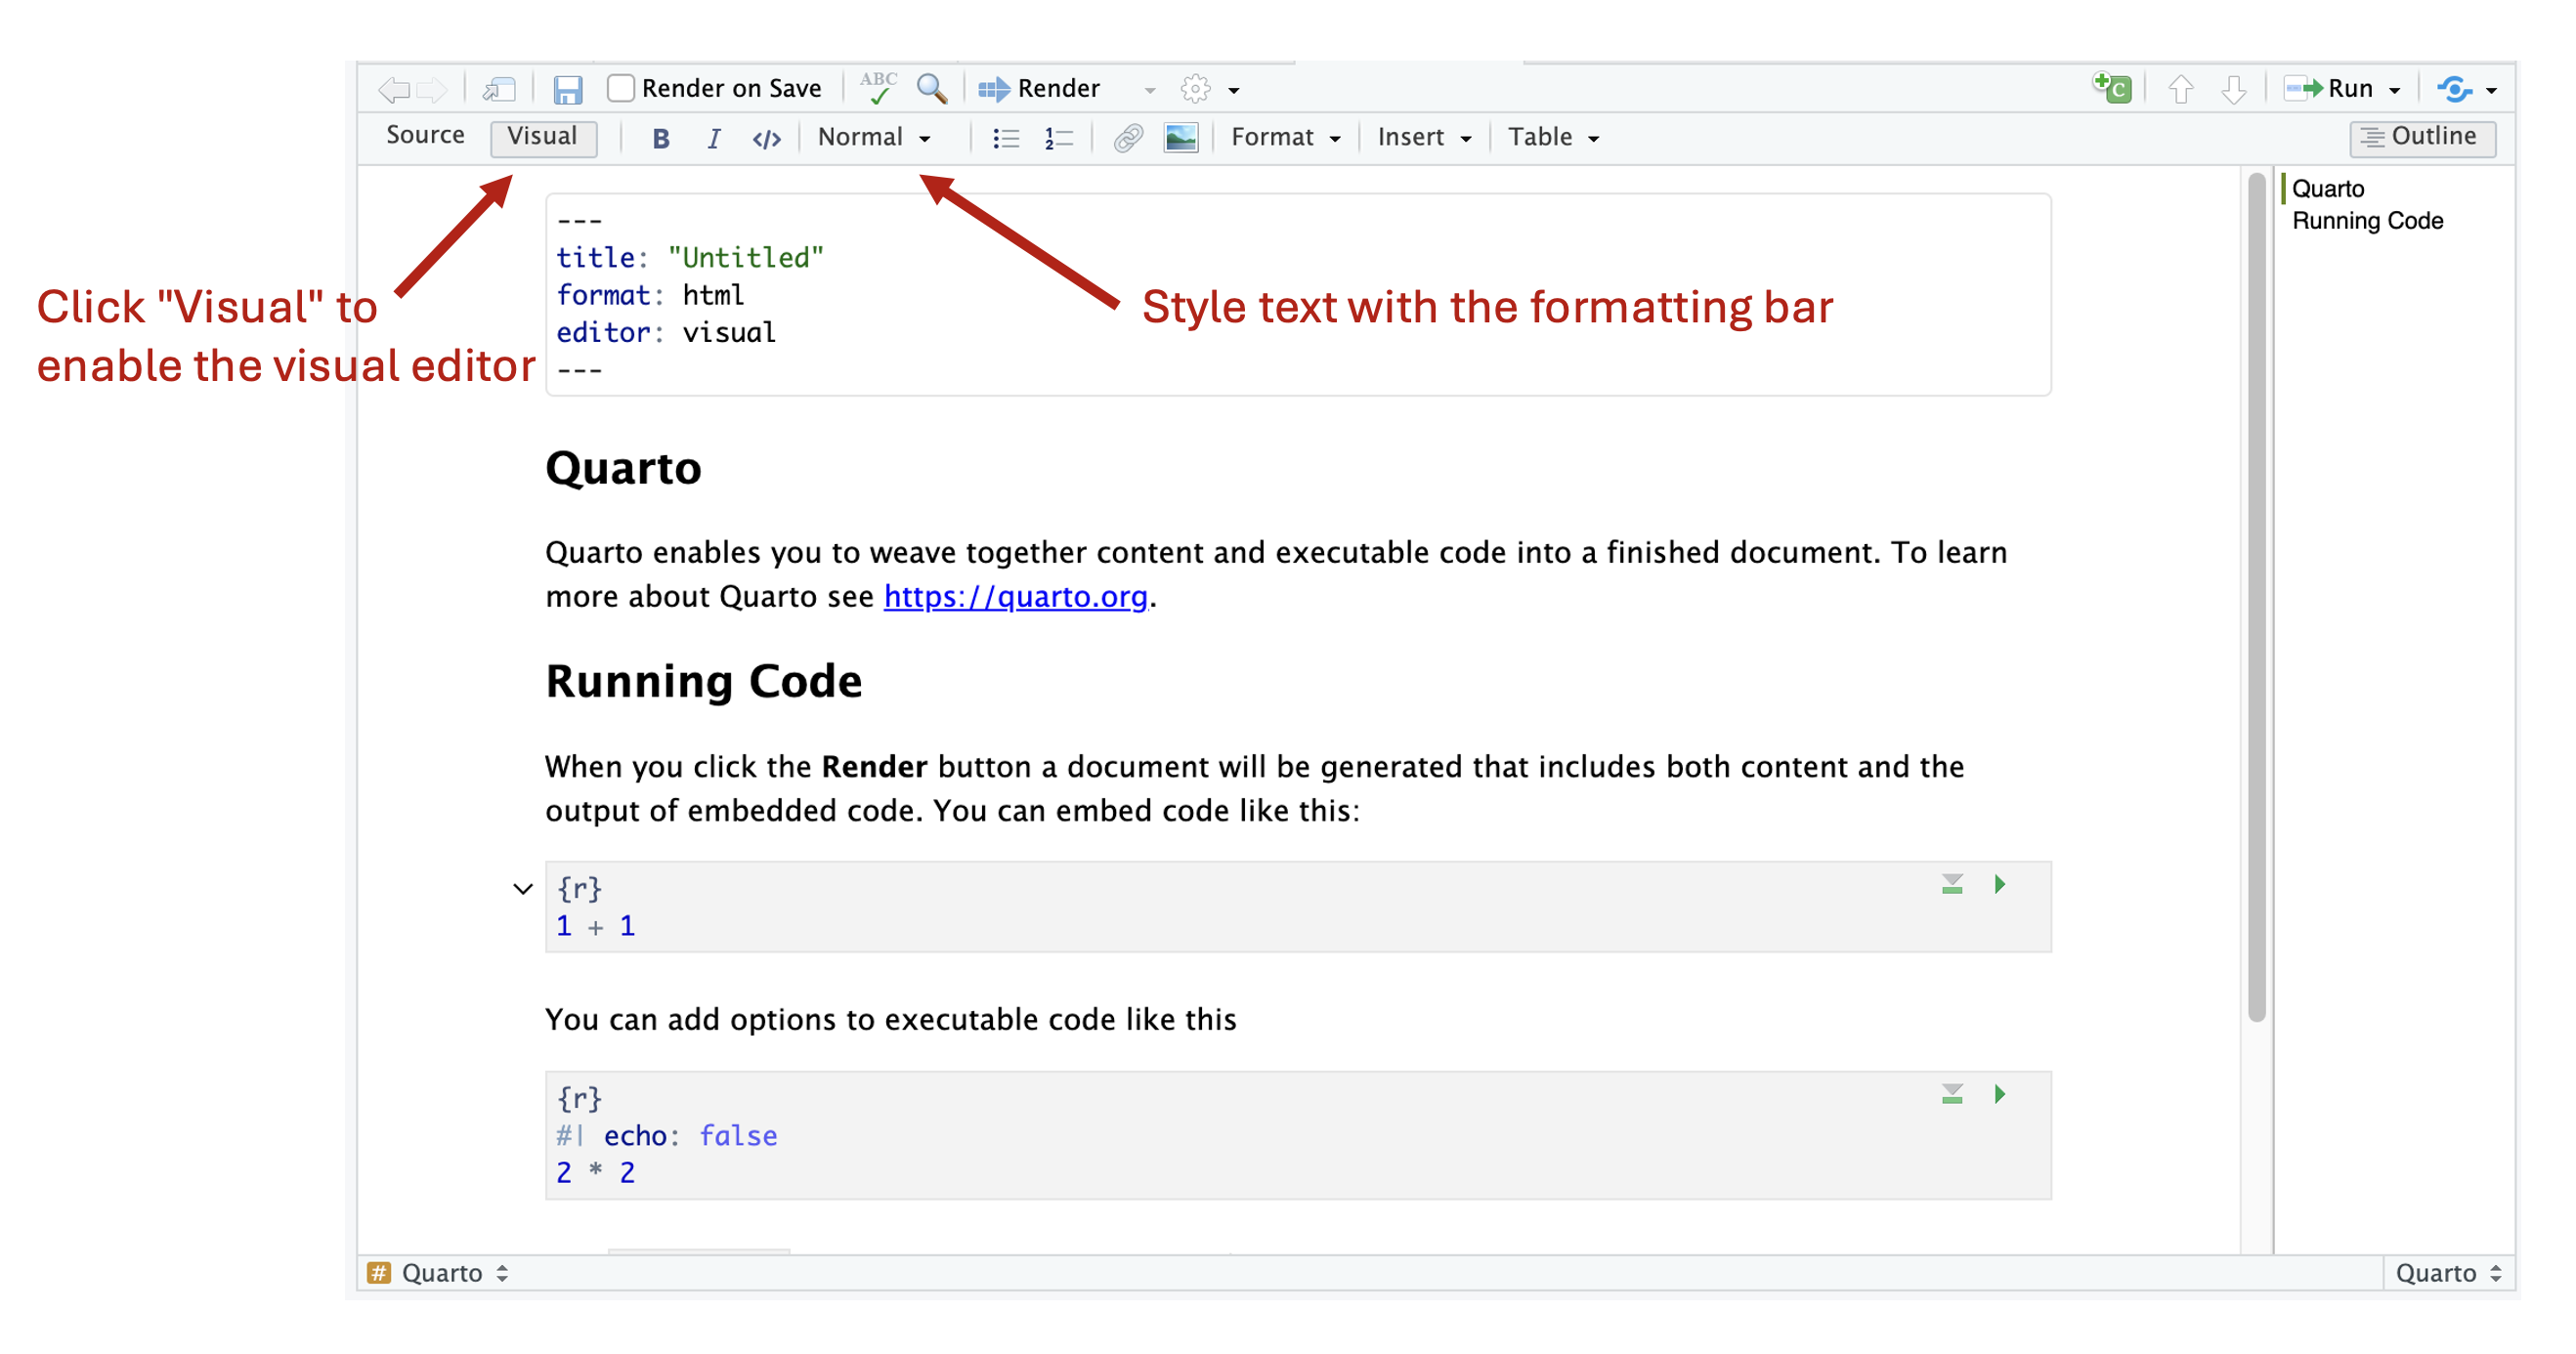
Figure 9.3: Visual editor for Quarto documents.
9.2.3 Code Blocks
Code blocks are where you enter R code to perform the actual analysis work. You can easily insert an R code block by typing / on a empty line in the .qmd file. This will bring up a block selection interface where you can select different types of block and objects to insert, including an R code block (first item in the interface by default). Once you add an R code block, you will see a new section added to the document with {r} at the top and a shaded background. This indicates you now have an R code block, and you can enter your R code into this shaded area. The green right facing triangle in the upper right side of the code block allows you to execute the code inside the block in the console. This is useful if you want to test out the code you’ve written.
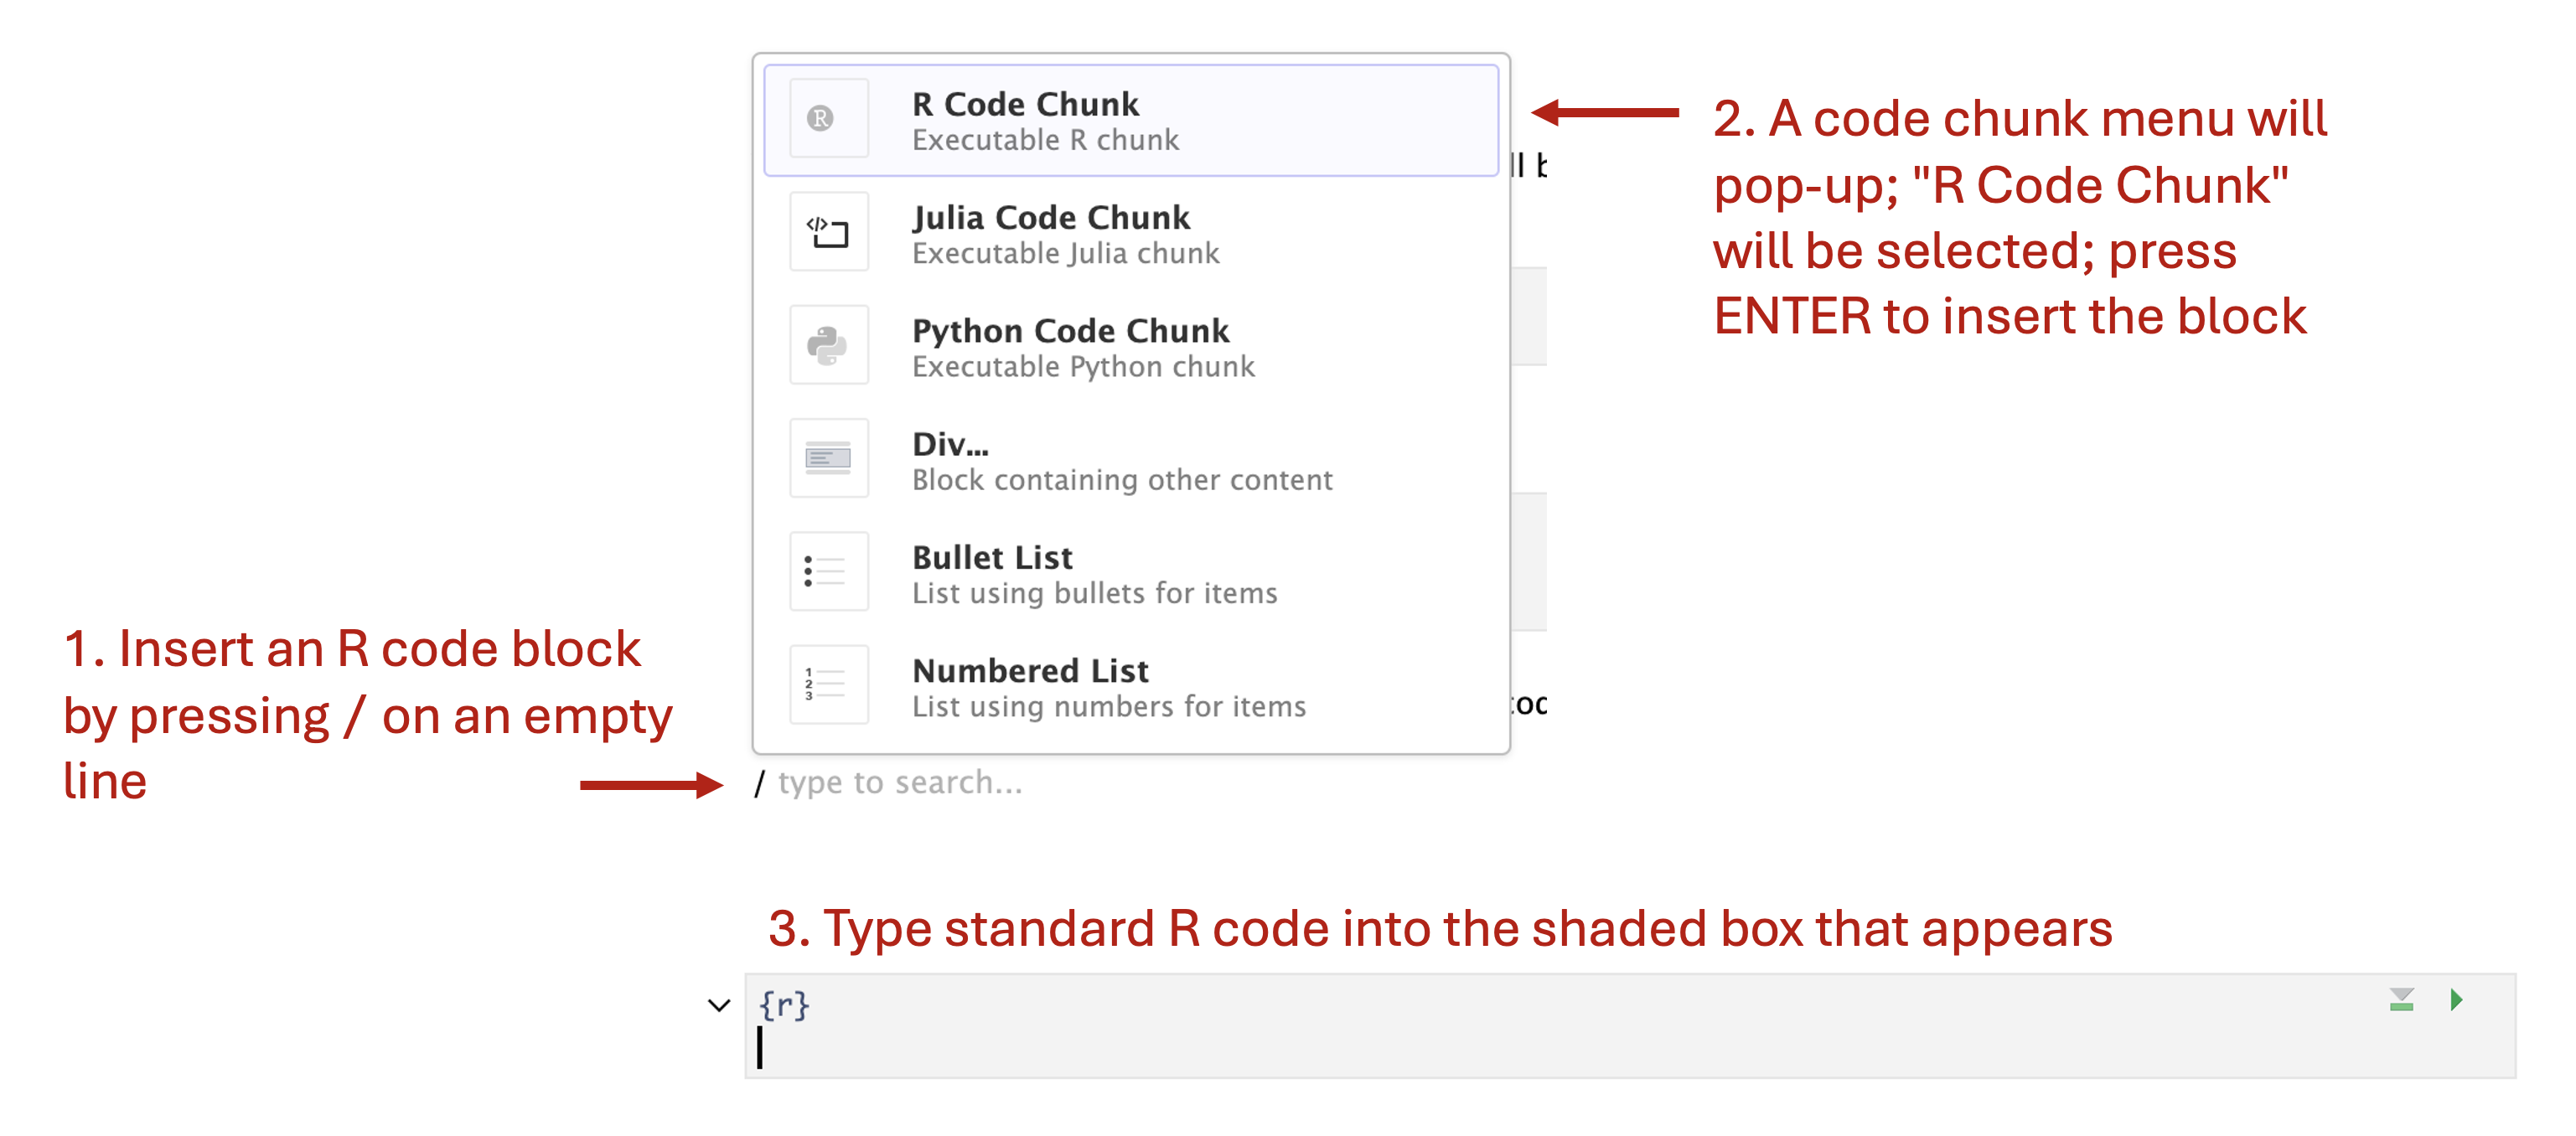
Figure 9.4: R Code blocks can be inserted using the / menu
When adding code to your document, you don’t need, nor is it suggested, to enter all your analysis code into a single block. Rather, it usually makes sense to break-up your analysis code into smaller pieces, interspersed with text blocks documenting your work. This makes it easier for you to develope your analysis, and for someone else to follow what you did. Like a standard R script, R code blocks are executed from top to bottom in the document, and any defined variables are accessible to all blocks that follow.
Unlike text blocks, which directly display the entered text into the output document, the output from code blocks depends on the options specified either in the YAML header (global options) or individually for each R code block. For example, you can control whether or not R code, the output from the code, and warning/error messages are shown in the output document. In the YAML header shown above, the options that are part of the execute: section indicate that R code should be output (echo: true) and warning messages should not (warning: false). Because these options are specified in the YAML header, all R code blocks will follow these options unless different options are specified within an R code block.
Code block level options can be specified at the top of a code block, by typing #| followed by an option string. Multiple options can be specified by entering them on multiple lines. Some useful code block options include:
fig-width:,fig-height:control the width and height of a plotfig-cap:add a figure captionecho:whether or not to display codewarning:whether or not to display warning or error messageseval:whether or not to actually execute the code when rendering (useful if you just want to output code)
An example of using code block options and how they affect output is shown in the figure below.
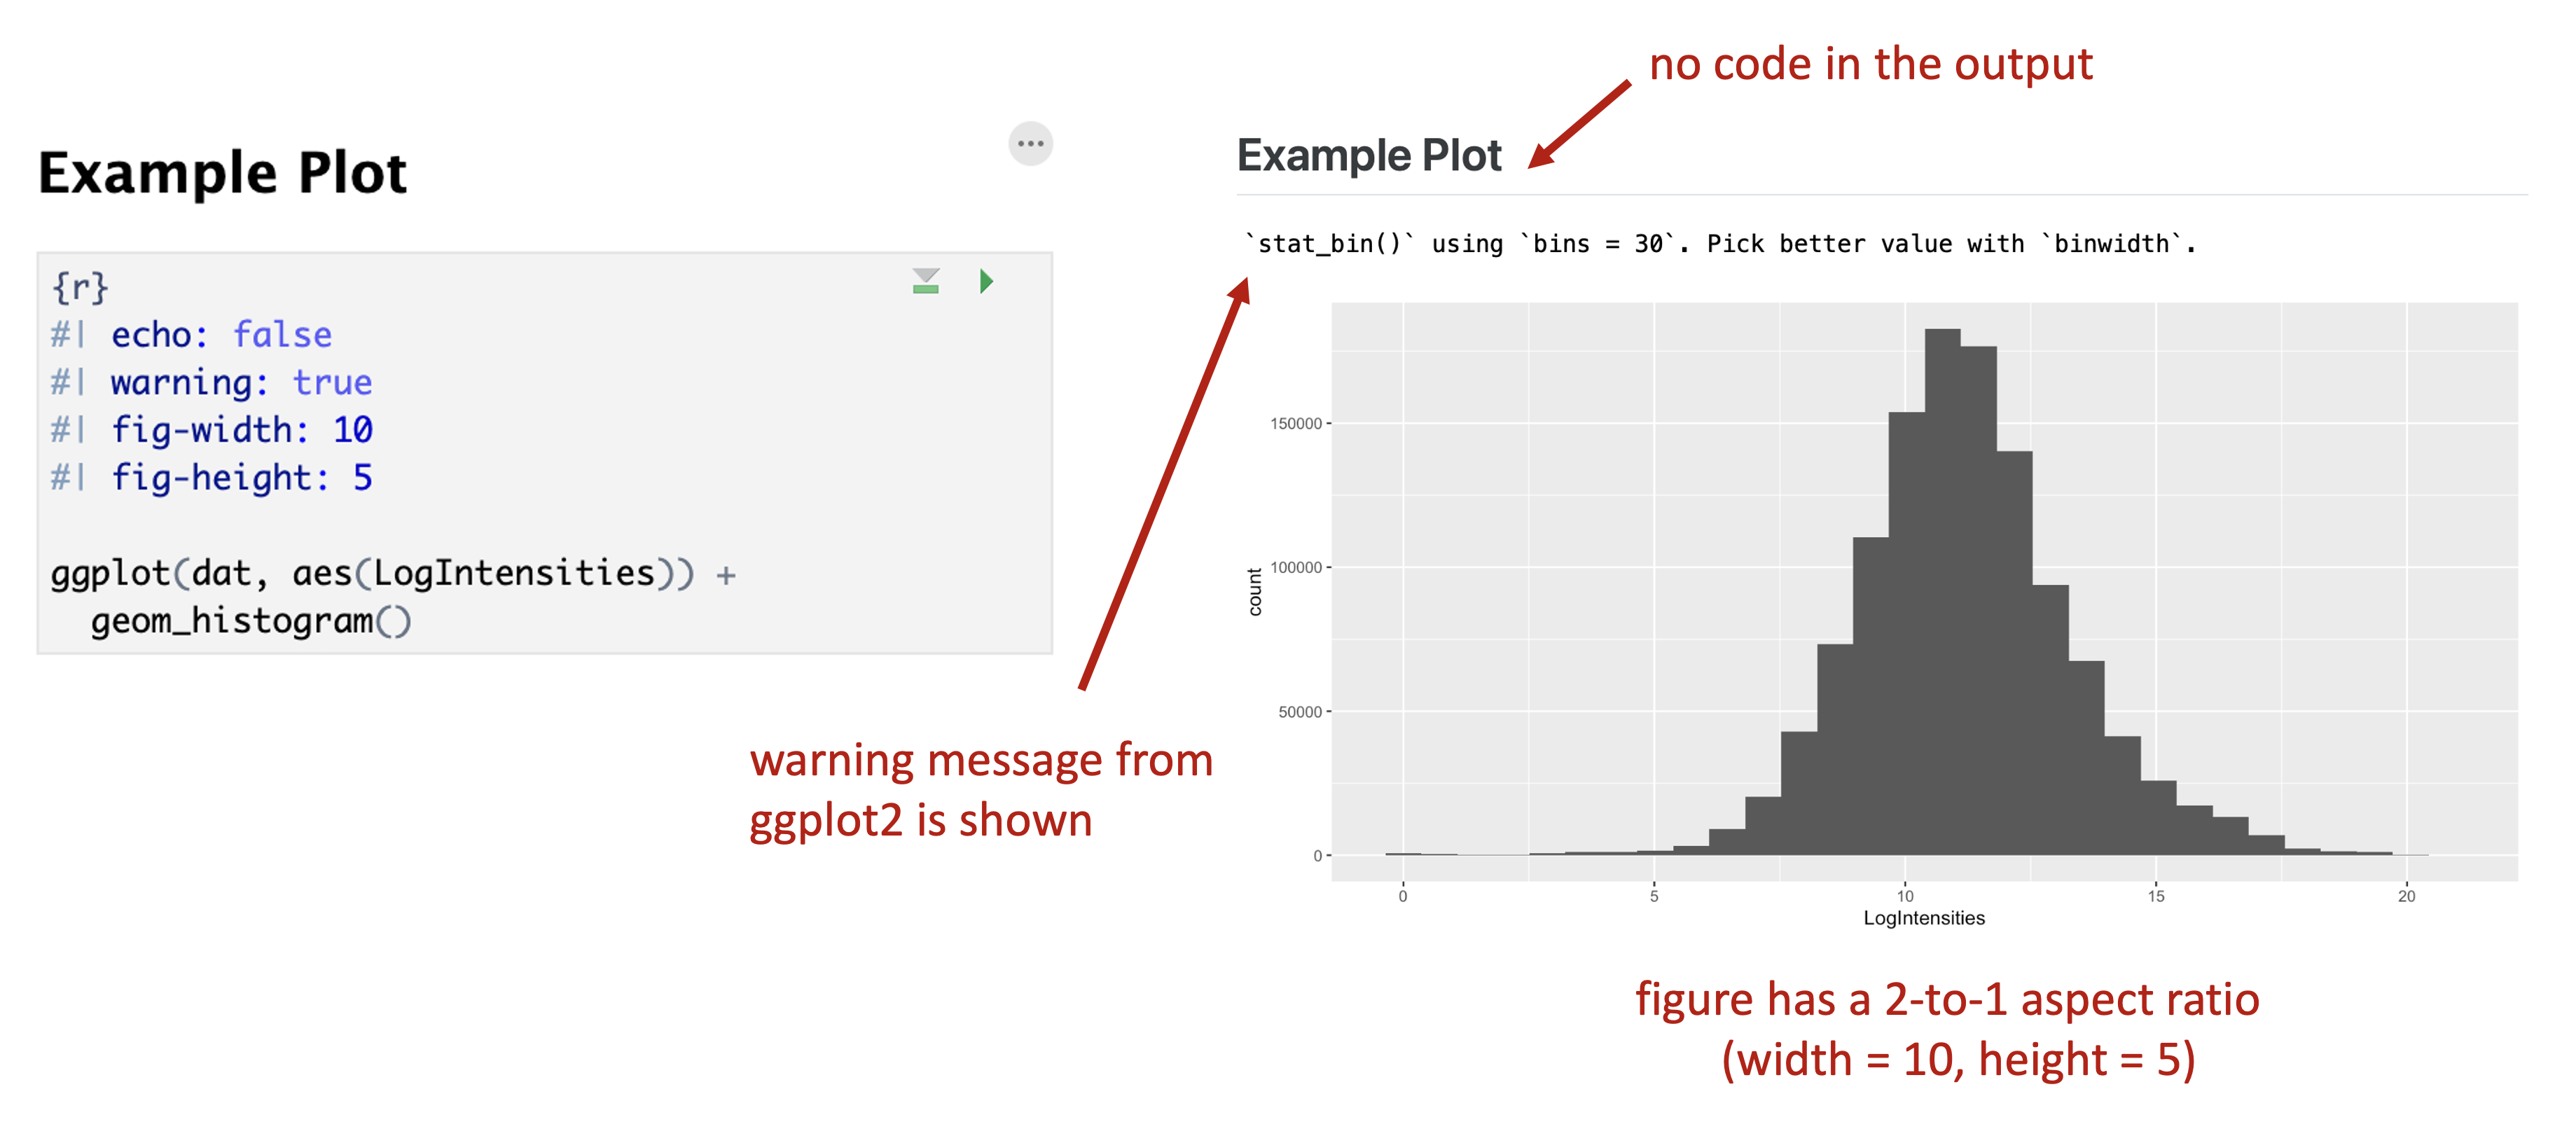
Figure 9.5: Example code block options and associated output.
9.2.4 Rendering
After you have finished writing a .qmd file, the final step is to render it into an output document. This can be easily accomplished by clicking the Render button in the tool bar of the Quarto editor pane inside of RStudio. The format of the output is indicated by the options set in the YAML header. For reports, PDFs and HTML files are useful output options. In practice, HTML output is highly suggested because HTML allows for interactivity in the document (like for webpages) that isn’t possible with PDF files. For example, HTML output allows you to have a floating table of contents within your document, and with more advanced R coding, you can also include interactive plots in your output. Furthermore, since web browsers are ubiquitous, HTML files can be opened by anyone and on any platform.
9.3 Packrat
Packrat is an R package that provides a way to manage R package dependencies for projects. It is a powerful tool for reproducible research, as it allows you to create a local library of packages specific to a project that can be shared with collaborators or moved to another machine. With Packrat, packages used in a project are kept at a specific version, ensuring that the same results can be obtained regardless of the version of the package used.
Initiating
To initiate a Packrat project, you need to run the packrat::init() function in your R console. This will create a packrat directory in your project folder, which will contain all the necessary files and information for Packrat to manage the package dependencies for your project.
Installing
To install a package into the project-specific library, you can use the packrat::install.packages() function. Packrat will automatically detect package dependencies and install them as well.
Loading
To load a package from the project library, you simply use the library() function as usual. Packrat will ensure that the correct versions are used.
Updating
To update a package in the project library, you can use the packrat::update.packages() function. Packrat will update the package and all its dependencies.
Overall, Packrat is a valuable tool for reproducible research, as it allows you to manage package dependencies for your projects and ensure that the same results can be obtained regardless of the version of the package used.
9.4 GitHub
GitHub is an online platform that provides version control and collaboration features for software development projects. It is widely used by developers to store and manage their code repositories, track changes made to code over time, and collaborate with others on projects. It is a powerful tool that simplifies the process of managing code and makes it easier for developers to work together. A key benefit of RStudio IDE is that it has built-in support for version control systems like GitHub, which makes it easy to manage and share code with others.
9.5 Docker
Docker is an open-source platform that allows developers to easily create, deploy, and run applications in containers. Containers are lightweight, portable, and self-contained environments that can run isolated applications. Docker helps to simplify the process of software development, testing, and deployment by providing a consistent environment that runs the same way on any machine, independent of the host operating system.
For more information check out the main Docker website in addition to the Rocker R Project.
9.6 R Packages
In R, packages are collections of R functions, data, and compiled code that can be easily shared and reused with others. They are an essential part of the R ecosystem and are used for a variety of purposes, such as data analysis, visualization, and statistical modeling.
Creating a package in R is a straightforward process, and RStudio IDE provides several tools to simplify the package development process. Packages are a way of organizing your code and data into a single, self-contained unit that can be easily shared and distributed with other R users.
Creating
To create a package in RStudio, follow these simple steps:
- Create a new R Project. Go to “File” -> “New Project” -> “New Directory” -> “R Package”
- Choose a name for the package, such as my_new_rpackage and a directory location where it will be saved.
- Once the project is created, RStudio will generate a basic package structure with the following files:
- DESCRIPTION: This file contains information about the package, such as its name, version, author, and dependencies.
- NAMESPACE: This file defines the package’s API, i.e., the set of functions and objects that are intended for public use.
- R/: This directory contains the package’s R source code files.
- man/: This directory contains the package’s documentation files.
- Now it’s time to write some code. You can start by creating a simple function that outputs “Hello ASMS”. Here’s an example:
#' Hello ASMS Function
#'
#' This function prints "Hello ASMS" to the console.
#'
#' @return A character vector with the message "Hello ASMS".
#' @export
say_hello <- function() {
  return("Hello ASMS")
}- Save the function in a new R script file called “hello_world.R” and place it in the package’s R/ directory.
- Build the package by running “Build” -> “Build & Reload” from the “Build” tab. This will compile the package code and create a binary package file (.tar.gz) in the “build/” directory.
- Finally, install the package by running “Install and Restart” from the “Build” tab. This will install the package on your local machine, making it available for use.
9.7 R Shiny Applications
R Shiny is an R package that allows users to create interactive web applications using R. With R Shiny, users can create and customize web-based dashboards, data visualization tools, and other interactive applications that can be easily shared with others.
The benefits of using R Shiny include creating powerful data-driven web applications with ease and providing a user-friendly interface for data analysis. R Shiny is widely used in various industries, including finance, healthcare, and e-commerce.
Creating
Creating an R Shiny application is relatively easy, and it can be done in the RStudio IDE. Here are the steps to follow:
Open RStudio and create a new R script file.
Install the ‘shiny’ R package by running the following command:
install.packages("shiny")Load the ‘shiny’ package by running the following command:
library(shiny)Create a new Shiny application by running the following command:
shinyApp(ui = ui, server = server)The ‘ui’ argument should contain the user interface (UI) code for the application, while the ‘server’ argument should contain the server-side code for the application.
Write the UI code and server-side code for your application, and save the file with a ‘.R’ extension.
Run the application by clicking on the ‘Run App’ button in the RStudio IDE, or by running the following command:
runApp("path/to/your/app.R")
Example
Here’s an example of an R Shiny application that allows users to plot points on a graph:
library(shiny)

# Define UI for application
ui <- fluidPage(
  titlePanel("Plotting Points"),
  sidebarLayout(
    sidebarPanel(
      numericInput("x", "X Coordinate:", 0),
      numericInput("y", "Y Coordinate:", 0),
      actionButton("plot", "Plot Point")
    ),
    mainPanel(
      plotOutput("plot")
    )
  )
)

# Define server logic
server <- function(input, output) {
  coords <- reactiveValues(x = numeric(), y = numeric())

  observeEvent(input$plot, {
    coords$x <- c(coords$x, input$x)
    coords$y <- c(coords$y, input$y)
  })

  output$plot <- renderPlot({
    plot(coords$x, coords$y, xlim = c(0, 10), ylim = c(0, 10), pch = 19, col = "blue")
  })
}

# Run the application
shinyApp(ui = ui, server = server)
In this example, the UI code defines a sidebar panel with input fields for the X and Y coordinates of a point, as well as a button to plot the point. The main panel contains a plot that displays all of the points that have been plotted by the user.
The server-side code defines a reactive variable called ‘coords’ which stores the X and Y coordinates of each plotted point. When the user clicks the ‘Plot Point’ button, an observer function is triggered that adds the new point to the ‘coords’ variable. The renderPlot function then plots all of the points on the graph.
Check out the R Shiny web page for more information.
Exercises
 |
|
Replace the default YAML header with the one specified in this chapter and render the document. Confirm the HTML output is successfully created.
Review the document and study the structure. Which parts are text blocks and which are code blocks? How are headings being used in the text blocks?
Try executing and editing the R code blocks using the green right-facing triangle. What happens when you execute a code block?
Insert a new R code block and add a ggplot code example from the Data Visualization section (make sure you load the required data first). What happens when you execute the code?
Change the options in the YAML header under
execute:to not include R code. Re-render the document to confirm.Add code block options to the ggplot code you added in 4 to change the figure with and height.