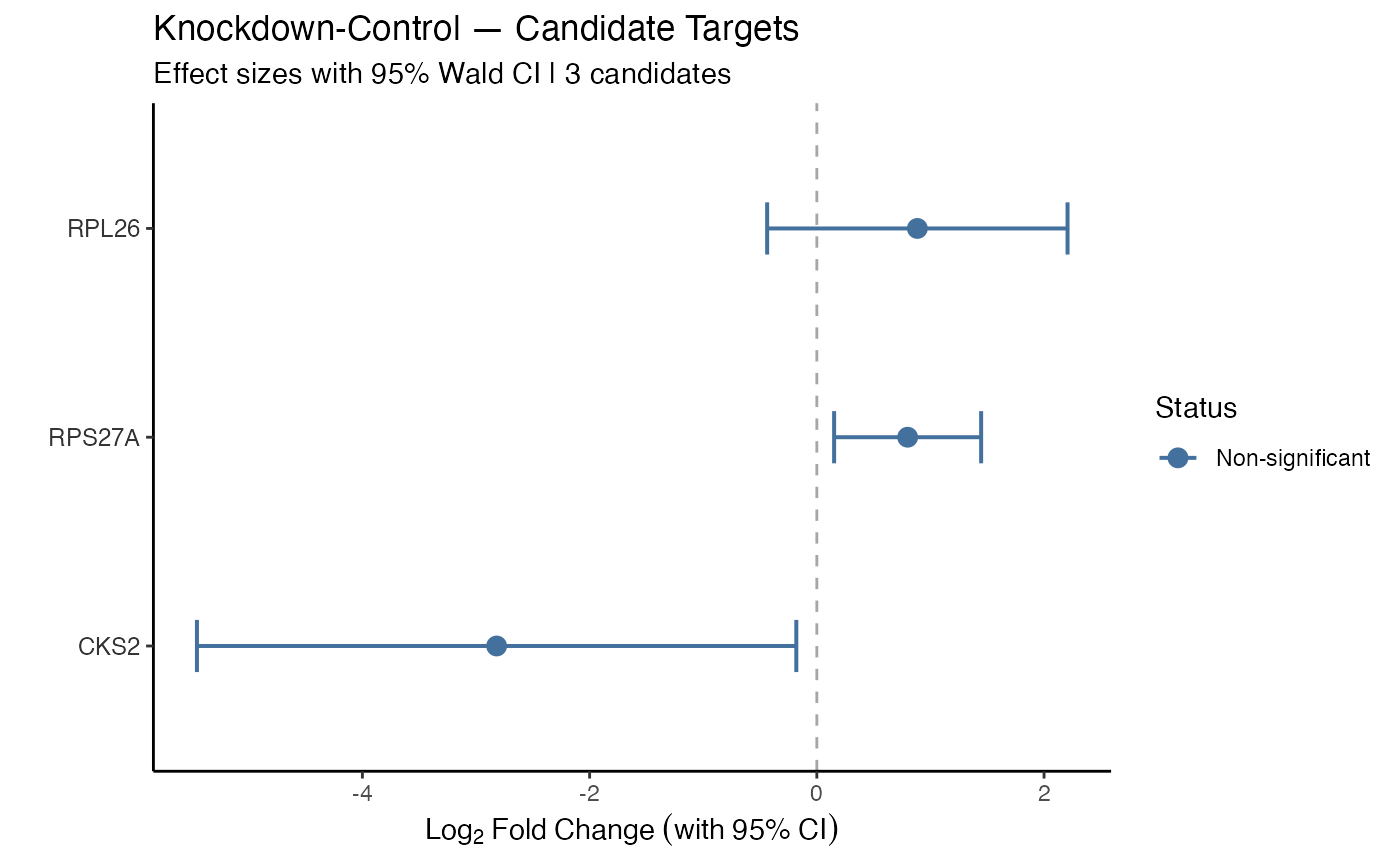
plot_candidates() visualizes effect sizes (log2 foldchange) along with Wald-type
confidence intervals for specific candidate proteins or literature-nominated
validation targets. Candidates can optionally be categorized and colored by validation status.
Usage
plot_candidates(
  data = NULL,
  ...,
  candidates = NULL,
  proteins = NULL,
  labels_column = "gene_name",
  status = NULL,
  status_column = NULL,
  confidence = 0.95,
  log2fc_column = "log2_foldchange",
  significance_column = "adj_p_value",
  significance_max = 0.05,
  show_title = TRUE,
  tag = NULL,
  destination = "plot",
  height = 6,
  width = 8,
  path = NULL
)

plot_forest(...)
Arguments
- data
a tidyproteomics data object (or an exported expression table)
- ...
passthrough ggplot2::ggsave arguments.
- candidates
a character vector of identifiers or gene names to include in the plot. If NULL, defaults to
proteinsor the top 15 candidates ranked by statistical significance and effect size.- proteins
alias for
candidatesfor backward compatibility.- labels_column
a character defining the column name for feature labeling. Default is "gene_name".
- status
an optional named character vector of validation status tags corresponding to gene/protein identifiers (e.g.
c(HERPUD1 = "Validated", RACGAP1 = "Empirical change")).- status_column
an optional column name in the expression table containing status annotations.
- confidence
numeric confidence level for intervals. Default is 0.95 (95% CI).
- log2fc_column
a character defining the column name of log2 foldchange values. Default is "log2_foldchange".
- significance_column
a character defining the column name of significance values. Default is "adj_p_value".
- significance_max
a numeric defining the significance threshold. Default is 0.05.
- show_title
boolean or character string for plot title. Default is TRUE.
- tag
optional character string to append to the plot file name.
- destination
character string indicating output type: "plot", "save", "png", "svg", "tiff", "jpeg". Default is "plot".
- height
numeric plot height in inches. Default is 6.
- width
numeric plot width in inches. Default is 8.
- path
optional path to save destination plot.
Examples
library(dplyr, warn.conflicts = FALSE)
library(tidyproteomics)

hela_proteins %>%
  expression(knockdown/control) %>%
  plot_candidates(
    knockdown/control,
    candidates = c("RPL26", "RPS27A", "CKS2"),
    labels_column = "gene_name"
  )
#> ℹ .. expression::t_test testing knockdown / control
#> ✔ .. expression::t_test testing knockdown / control [3.2s]
#>