Enrichment
enrichment.RmdTerm Enrichment
Available Methods
| GSEA |
Korotkevich G, Sukhov V, Sergushichev A (2019). “Fast gene set enrichment analysis.” bioRxiv. doi:10.1101/060012, http://biorxiv.org/content/early/2016/06/20/060012. |
| Wilcoxon Rank Sum |
H. B. Mann, D. R. Whitney “On a Test of Whether one of Two Random Variables is Stochastically Larger than the Other,” Ann. Math. Statist. 18(1), 50-60, (March, 1947) [R::stats::wilcoxon] |
| Fisher’s Excact Test |
Fisher, R. A. “On the Interpretation of χ2 from Contingency Tables, and the Calculation of P.” Journal of the Royal Statistical Society, vol. 85, no. 1, 1922, pp. 87–94. [R::stats::fisher.test] |
Term enrichment analysis is possible proceeding an expression
analysis with the enrichment() function, employing either
the GSEA algorithm, a simple Wilcoxon rank sum
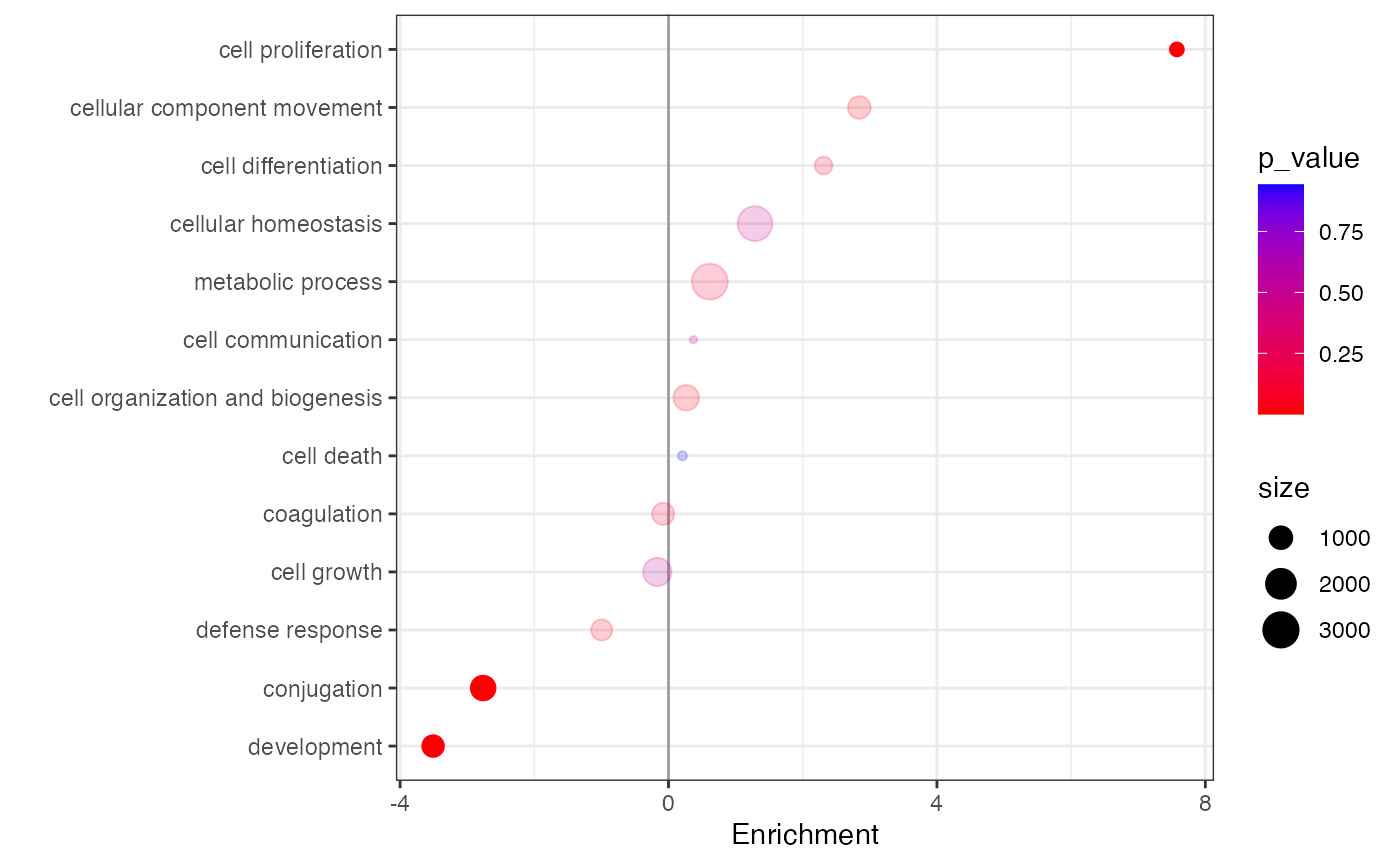
comparison, or Fisher’s Exact Test and can be visualized with
the plot_enrichment() function. Both GSEA and
Wilcoxon will consider genes of a given term significant if
those genes are skewed mostly up or down. The Fisher’s Exact
Test will consider genes of a given term significant if they are
“represented” more often than expected – this is the basis of
Over-Representation Analysis and will consider the
gene-set regardless of being skewed mostly up or down.
library("dplyr")
library("tidyproteomics")

rdata <- hela_proteins %>%
  normalize(.method = 'linear') %>%
  expression(knockdown/control) %>%
  enrichment(knockdown/control,
             .terms = 'biological_process',
             .method = 'wilcoxon')
Exporting Results
The results of this analysis are stored in the tidyproteomics data-object and can easily be exported to save as a flat data table or used in an external down stream analysis.
rdata %>%
  export_analysis(knockdown/control,
                  .analysis = 'enrichment',
                  .term = 'biological_process')
#> # A tibble: 13 × 5
#>    annotation                         p_value adj_p_value enrichment  size
#>    <chr>                                <dbl>       <dbl>      <dbl> <int>
#>  1 conjugation                      0.0000213    0.000277   0.0257    1227
#>  2 cell proliferation               0.000292     0.00350   -0.0704     301
#>  3 development                      0.00653      0.0719     0.0326     879
#>  4 cellular component movement      0.0172       0.172     -0.0264    1015
#>  5 cell organization and biogenesis 0.0249       0.224     -0.00246   1373
#>  6 defense response                 0.0590       0.472      0.00925    848
#>  7 cell differentiation             0.109        0.765     -0.0215     551
#>  8 metabolic process                0.151        0.907     -0.00572   3179
#>  9 coagulation                      0.168        0.907      0.000746   961
#> 10 cell communication               0.441        1         -0.00345    157
#> # ℹ 3 more rows
The results can also have any other terms appended to the output, such as protein or gene_name, which may be useful for follow-on analyses.
rdata %>%
  export_analysis(knockdown/control,
                  .analysis = 'enrichment',
                  .term = 'biological_process',
                  .append = 'gene_name')
#> # A tibble: 13 × 6
#>    annotation                    p_value adj_p_value enrichment  size gene_names
#>    <chr>                           <dbl>       <dbl>      <dbl> <int> <chr>
#>  1 conjugation                   2.13e-5    0.000277   0.0257    1227 DYNC1H1, …
#>  2 cell proliferation            2.92e-4    0.00350   -0.0704     301 PRKDC, HU…
#>  3 development                   6.53e-3    0.0719     0.0326     879 PRKDC, FL…
#>  4 cellular component movement   1.72e-2    0.172     -0.0264    1015 PRKDC, PR…
#>  5 cell organization and biogen… 2.49e-2    0.224     -0.00246   1373 PRKDC, FL…
#>  6 defense response              5.90e-2    0.472      0.00925    848 PLEC, PRK…
#>  7 cell differentiation          1.09e-1    0.765     -0.0215     551 PLEC, DYN…
#>  8 metabolic process             1.51e-1    0.907     -0.00572   3179 PLEC, AHN…
#>  9 coagulation                   1.68e-1    0.907      0.000746   961 PLEC, FAS…
#> 10 cell communication            4.41e-1    1         -0.00345    157 TLN1, DSP…
#> # ℹ 3 more rows