Automating
automating.RmdAutomating data analysis
In Tidyproteomics both the expression() and enrichment() analyses can be automated to run through a list of sample pairs, running the analysis first and then generating the associated plots and tables.
Both the expression() and enrichment() functions have been updated to now include the .pairs option which accepts a list of multiple two sample pairs which you can define outside the functions:
pairs <- list(
  c('experiment_A', 'control'),
  c('experiment_B', 'control'),
  c('experiment_C', 'control'),
  c('experiment_B', 'experiment_A'),
  c('experiment_C', 'experiment_A')
)
The enrichment() function has changed the .term variable to .terms to also accept either a single term or multiple terms defined as a string vector:
terms <- "biological_process"

# -- or --

terms <- c("biological_process",
           "cellular_component",
           "molecular_function",
           "wiki_pathway",
           "reactome_pathway")
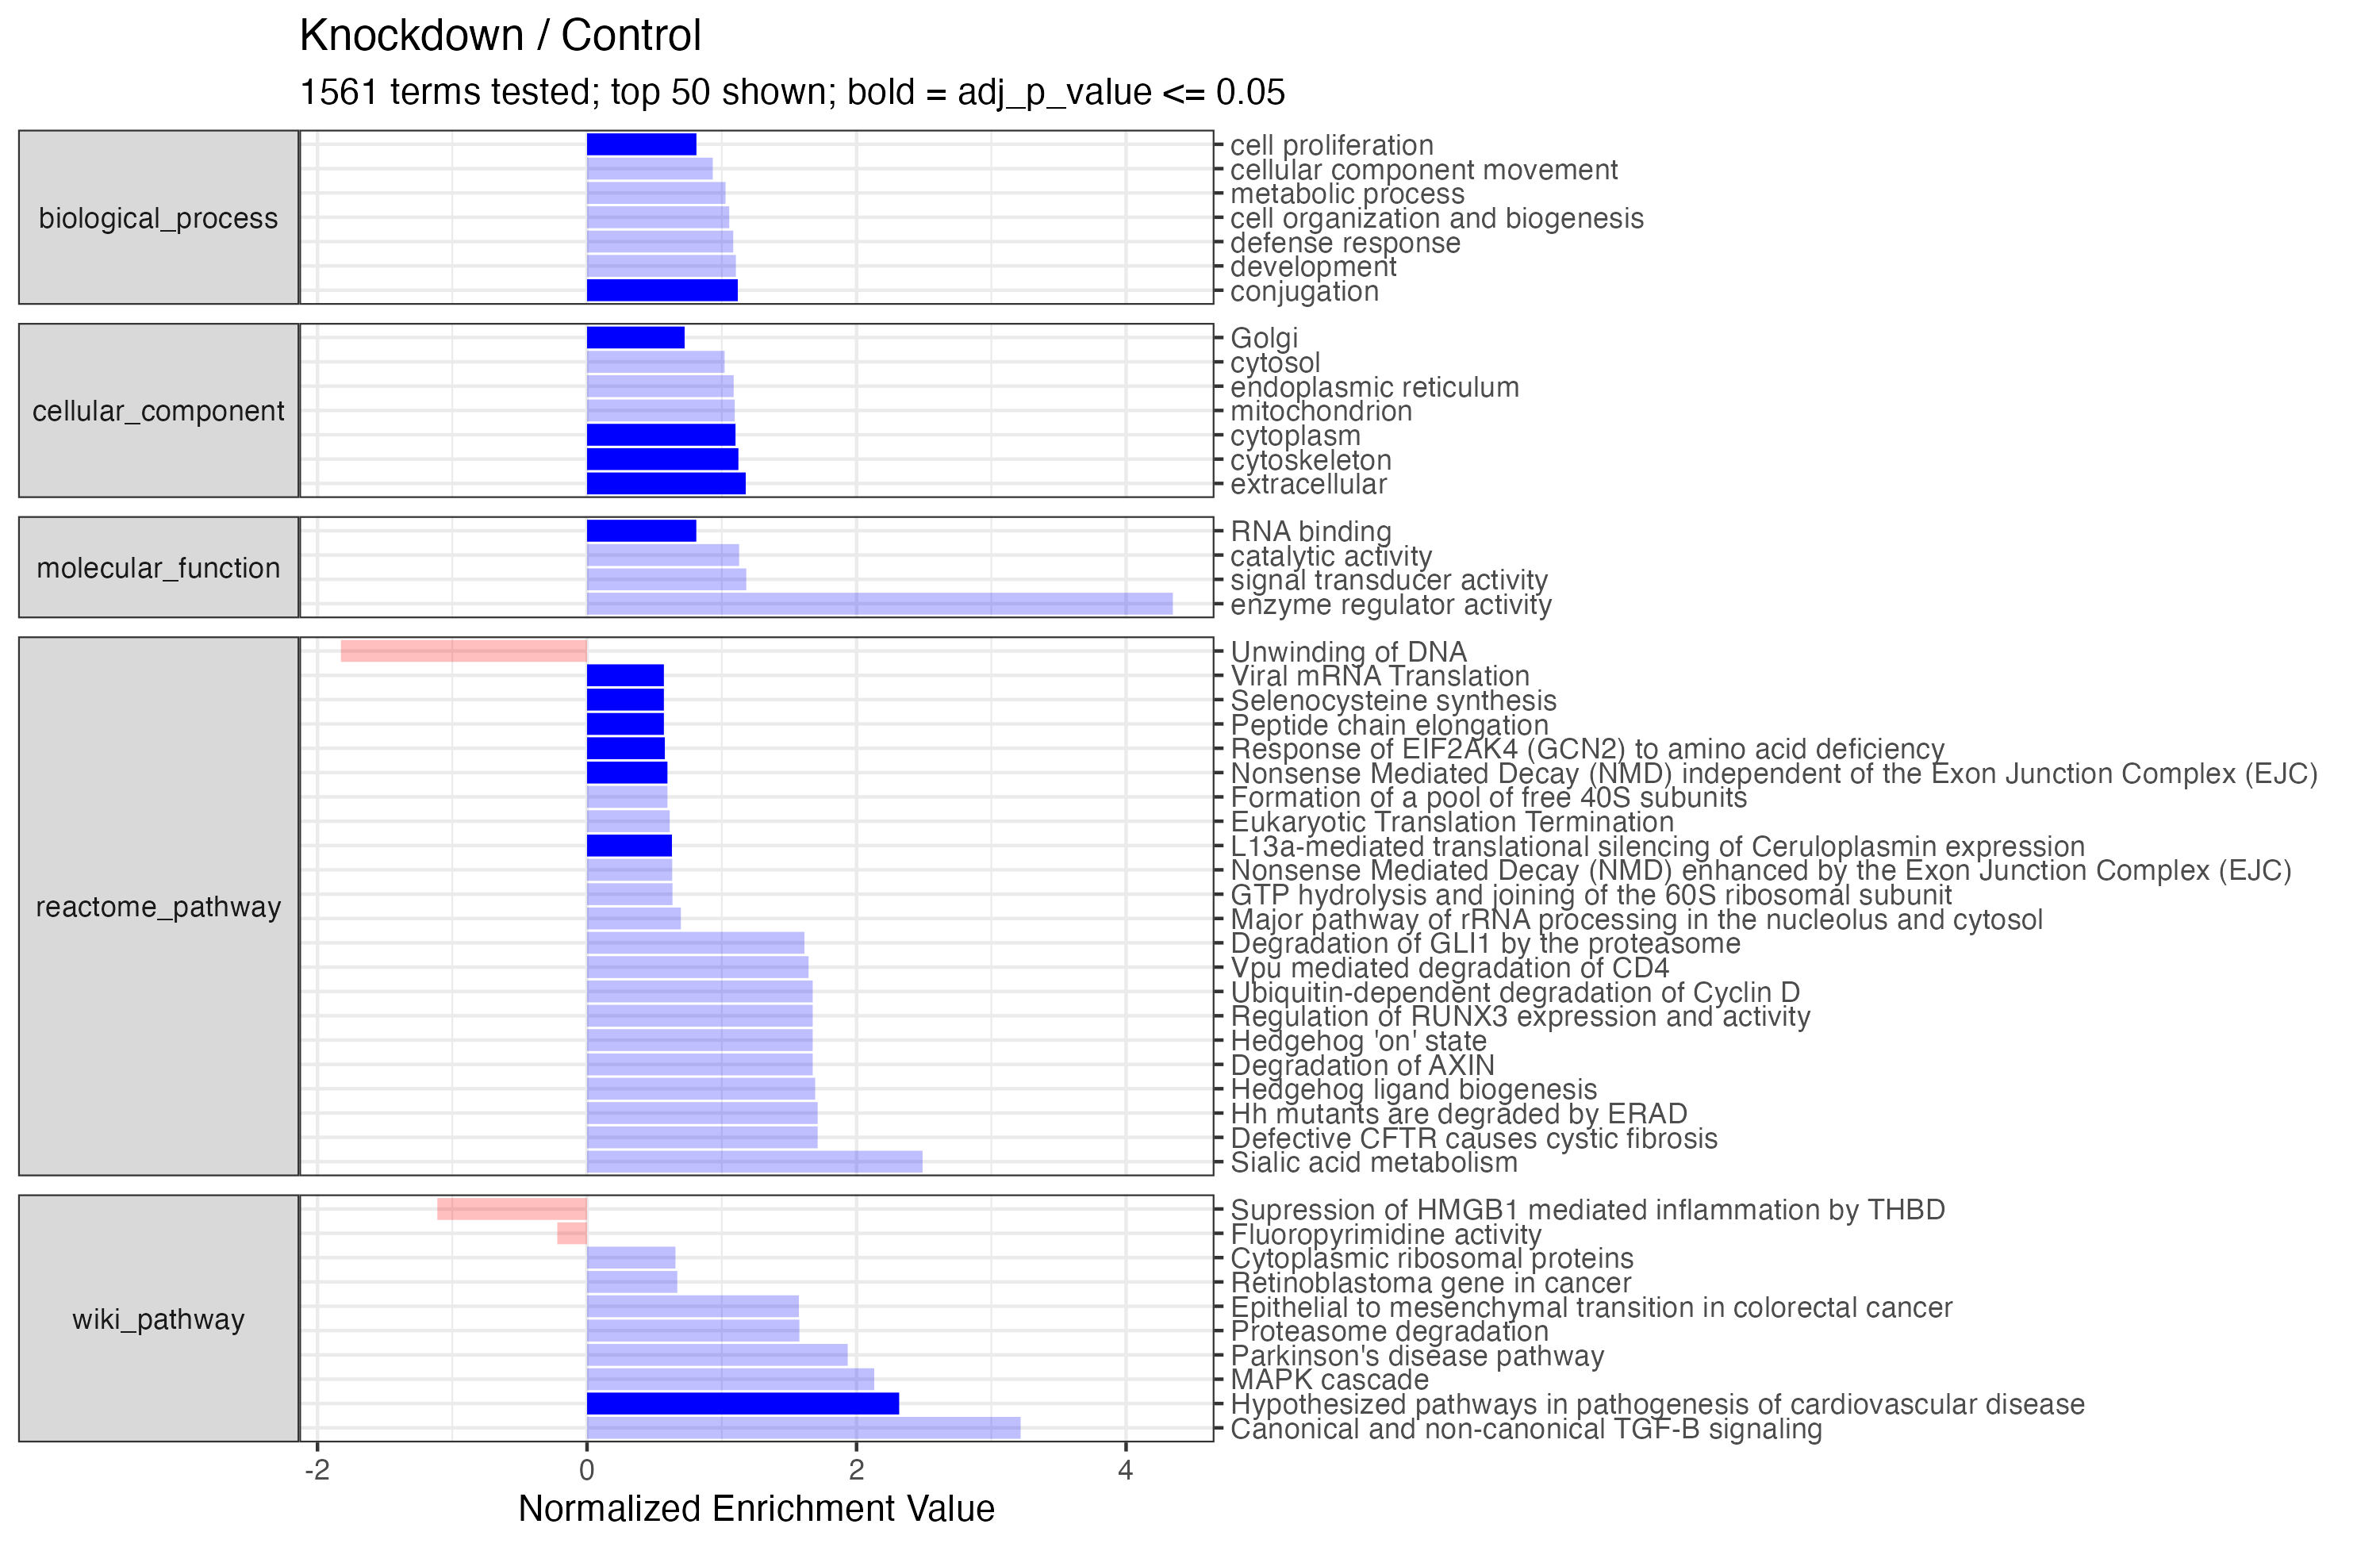
The two new functions analyze_expressions() and analyze_enrichments() will then iterate through the analyses and save out plots and tables. The final plot for analyze_enrichments() will generate a concatenated single bar plot for all terms tested - individual bubble plots for each term can be created separately. Note, the analyze_enrichments() function takes the additional parameter significance_max to provide a cutoff for significance highlighting.
pairs <- list(
  c('knockdown', 'control'))

terms <- c("biological_process",
           "cellular_component",
           "molecular_function",
           "wiki_pathway",
           "reactome_pathway")

hela_proteins <- hela_proteins %>%
  # perform the calculations
  expression(.pairs = pairs) %>%
  enrichment(.pairs = pairs, .terms = terms, .cpu_cores = 4, .method = 'wilcoxon') %>%
  # run the analysis that saves out plots and tables
  analyze_expressions(labels_column = 'gene_name') %>%
  analyze_enrichments(significance_max = 0.05)
Expression Analysis - using the supplied 1 sample pairs ...
✔ .. expression::t_test testing knockdown / control [3.5s]
Enrichment Analysis - using the supplied 1 sample pairs ...
✔ .. enrichment::wilcoxon testing knockdown / control by term biological_process [1.6s]
✔ .. enrichment::wilcoxon testing knockdown / control by term cellular_component [1.5s]
✔ .. enrichment::wilcoxon testing knockdown / control by term molecular_function [1.2s]
✔ .. enrichment::wilcoxon testing knockdown / control by term wiki_pathway [48s]
✔ .. enrichment::wilcoxon testing knockdown / control by term reactome_pathway [1m 58.6s]
ℹ no values significant at current settings
ℹ ... log2_foldchange (1) and adj_p_value (0.05)
ℹ Saved plot_volcano.pngEach plot and table are save in the local directory and labeled accordingly.
The Enrichment Table
#> # A tibble: 1,561 × 6
#>    term               annotation            p_value adj_p_value enrichment  size
#>    <chr>              <chr>                   <dbl>       <dbl>      <dbl> <int>
#>  1 biological_process conjugation           2.28e-6   0.0000296      1.12   1227
#>  2 biological_process cell proliferation    5.98e-4   0.00717        0.812   301
#>  3 biological_process cell organization an… 5.80e-3   0.0638         1.06   1373
#>  4 biological_process development           9.02e-3   0.0902         1.10    879
#>  5 biological_process cellular component m… 9.58e-3   0.0902         0.933  1015
#>  6 biological_process defense response      2.19e-2   0.175          1.08    848
#>  7 biological_process metabolic process     7.89e-2   0.552          1.03   3179
#>  8 biological_process coagulation           1.39e-1   0.833          1.08    961
#>  9 biological_process cell differentiation  1.49e-1   0.833          0.953   551
#> 10 biological_process cell growth           1.63e-1   0.833          1.06   1782
#> # ℹ 1,551 more rows
"./proteins_enrichment_knockdown.png" %>% magick::image_read()The Enrichment Plot 