Summarizing
summarizing.RmdSummarizing proteomics data is vital to understanding the bigger
picture and conveying summary stats that set the tone for the larger
analysis. The results of each summary can be directed to via the
destination option to "print" on screen,
"save" to a file or "return" as a tibble.
Printing
The tidyproteomics data object can be printed to show a summary of the object contents.
hela_proteins
#>
#> ── Quantitative Proteomics Data Object ──
#>
#> Origin          ProteomeDiscoverer
#>                 proteins (10.67 MB)
#> Composition     6 files
#>                 2 samples (control, knockdown)
#> Quantitation    7055 proteins
#>                 4 log10 dynamic range
#>                 28.8% missing values
#>  *imputed
#> Accounting      (4) num_peptides num_psms num_unique_peptides imputed
#> Annotations     (9) description biological_process cellular_component molecular_function
#>                 gene_id_entrez gene_name wiki_pathway reactome_pathway
#>                 gene_id_ensemble
#>
And these can expand to encompass additions generated through other operations.
hela_proteins %>% expression(knockdown/control) %>% enrichment(knockdown/control, .terms = 'biological_process')
#> ℹ .. expression::t_test testing knockdown / control
#> ✔ .. expression::t_test testing knockdown / control [3.4s]
#>
#> ℹ .. enrichment::gsea testing knockdown / control by term biological_process
#> ✔ .. enrichment::gsea testing knockdown / control by term biological_process [1…
#>
#> ── Quantitative Proteomics Data Object ──
#>
#> Origin          ProteomeDiscoverer
#>                 proteins (11.40 MB)
#> Composition     6 files
#>                 2 samples (control, knockdown)
#> Quantitation    7055 proteins
#>                 4 log10 dynamic range
#>                 28.8% missing values
#>  *imputed
#> Accounting      (4) num_peptides num_psms num_unique_peptides imputed
#> Annotations     (9) description biological_process cellular_component molecular_function
#>                 gene_id_entrez gene_name wiki_pathway reactome_pathway
#>                 gene_id_ensemble
#> Analyses        (1)
#>                 knockdown/control -> expression & enrichment (biological_process)
#>
Summarizing
Groups
The tidyproteomics data object can summarize the quantitative and accounting data …
hela_proteins %>% summary()
#> ── Summary: global ──
#>
#>  proteins peptides peptides_unique quantifiable  CVs
#>      7055    66329           58706        0.908 0.25
#>
… using columns corrisponing to experimental meta-data …
hela_proteins %>% summary(by = 'sample')
#>
#> ── Summary: sample ──
#>
#>     sample proteins peptides peptides_unique quantifiable  CVs
#>    control     7055    66329           58706        0.908 0.16
#>  knockdown     7055    66329           58706        0.909 0.21
#>
… terms in the annotation meta-data …
hela_proteins %>% summary(by = 'biological_process')
#>
#> ── Summary: biological_process ──
#>
#>                biological_process proteins peptides peptides_unique
#>                cell communication        9      100              93
#>                        cell death        1        3               1
#>              cell differentiation        3        9               9
#>                       cell growth      104     1419             839
#>  cell organization and biogenesis       17      241             241
#>                cell proliferation     7055    66329           58706
#>       cellular component movement        6       13              11
#>              cellular homeostasis      324     2854            2631
#>                       coagulation        9       68              58
#>                       conjugation      181     1460            1240
#>                  defense response       15       83              76
#>                       development       38      180             164
#>                 metabolic process      342     2804            2422
#>  quantifiable   CVs
#>         0.920 0.200
#>         1.000 0.340
#>         0.389 0.305
#>         0.803 0.280
#>         0.967 0.210
#>         0.908 0.250
#>         0.679 0.410
#>         0.938 0.260
#>         0.885 0.220
#>         0.893 0.260
#>         0.709 0.275
#>         0.730 0.245
#>         0.886 0.250
#>
… and even terms in the accounting data …
hela_proteins %>% summary(by = 'num_peptides')
#> ℹ Too many variables, limiting to the first 25
#>
#> ── Summary: num_peptides ──
#>
#>  num_peptides proteins peptides peptides_unique quantifiable   CVs
#>           228        1      228              59          1.0 0.180
#>           200        1      200             200          1.0 0.230
#>           177        1      177             177          1.0 0.230
#>           171        1      171               2          0.5 0.140
#>           166        1      166             166          1.0 0.170
#>           122        1      122             122          1.0 0.210
#>           119        1      119             119          1.0 0.160
#>           117        1      117             117          1.0 0.150
#>           114        1      114             114          1.0 0.320
#>           112        1      112              89          1.0 0.260
#>           109        1      109              77          1.0 0.150
#>           106        2      212             202          1.0 0.220
#>           105        1      105              84          1.0 0.180
#>           102        1      102              92          1.0 0.230
#>            98        2      196             168          1.0 0.250
#>            97        2      194             173          1.0 0.360
#>            92        1       92              92          1.0 0.220
#>            87        1       87              87          1.0 0.190
#>            82        2      164             164          1.0 0.215
#>            80        1       80              80          1.0 0.140
#>            78        1       78              60          1.0 0.230
#>            77        3      231             225          1.0 0.190
#>            76        2      152             152          1.0 0.335
#>            73        2      146             146          1.0 0.345
#>            71        1       71              38          1.0 0.290
#>
Contamination
In addition, the data can account for any type of contamination. If the key word “CRAP” is use then the data will partition out by Keratin, BSA, Trypsin and Other, so long as the protein descriptions contain CRAP and presumably originate from the CRAPome. However, any FASTA file, used at the data translation step (eg with ProteomeDiscoverer), and manipulated to contain CRAP in the description can be utilized.
hela_proteins %>% summary(contamination = 'CRAP')
#>
#> ── Summary: contamination ──
#>
#>     sample replicate native   BSA Keratin    Other Trypsin sample_id
#>    control         1  92.7% 3.66%   3.56%  0.0023%    0.1%  9e6ed3ba
#>    control         2    92% 4.02%   3.89% 0.00205%  0.123%  cc56fc1d
#>    control         3    92% 4.01%    3.9% 0.00208%  0.113%  6a21f7a9
#>  knockdown         1    92% 4.01%   3.88% 0.00183%  0.125%  966be57f
#>  knockdown         2  92.7% 3.66%   3.59%  0.0023% 0.0648%  79a98e41
#>  knockdown         3  92.2% 3.89%   3.82% 0.00232% 0.0679%  9f804505
#>                 import_file sample_file
#>  p97KD_HCT116_proteins.xlsx          F1
#>  p97KD_HCT116_proteins.xlsx          F4
#>  p97KD_HCT116_proteins.xlsx          F5
#>  p97KD_HCT116_proteins.xlsx          F2
#>  p97KD_HCT116_proteins.xlsx          F3
#>  p97KD_HCT116_proteins.xlsx          F6
#>
Alternatively, any protein descriptor can also be use …
hela_proteins %>% summary(contamination = 'Trypsin')
#>
#> ── Summary: contamination ──
#>
#>     sample replicate native Trypsin sample_id                import_file
#>    control         1  99.9%  0.104%  9e6ed3ba p97KD_HCT116_proteins.xlsx
#>    control         2  99.9%  0.128%  cc56fc1d p97KD_HCT116_proteins.xlsx
#>    control         3  99.9%  0.117%  6a21f7a9 p97KD_HCT116_proteins.xlsx
#>  knockdown         1  99.9%   0.13%  966be57f p97KD_HCT116_proteins.xlsx
#>  knockdown         2  99.9% 0.0672%  79a98e41 p97KD_HCT116_proteins.xlsx
#>  knockdown         3  99.9% 0.0707%  9f804505 p97KD_HCT116_proteins.xlsx
#>  sample_file
#>           F1
#>           F4
#>           F5
#>           F2
#>           F3
#>           F6
#>
… and as such.
hela_proteins %>% summary(contamination = 'ribosome')
#>
#> ── Summary: contamination ──
#>
#>     sample replicate native ribosome sample_id                import_file
#>    control         1  99.8%   0.155%  9e6ed3ba p97KD_HCT116_proteins.xlsx
#>    control         2  99.8%    0.15%  cc56fc1d p97KD_HCT116_proteins.xlsx
#>    control         3  99.8%   0.156%  6a21f7a9 p97KD_HCT116_proteins.xlsx
#>  knockdown         1  99.8%   0.171%  966be57f p97KD_HCT116_proteins.xlsx
#>  knockdown         2  99.8%   0.166%  79a98e41 p97KD_HCT116_proteins.xlsx
#>  knockdown         3  99.8%   0.164%  9f804505 p97KD_HCT116_proteins.xlsx
#>  sample_file
#>           F1
#>           F4
#>           F5
#>           F2
#>           F3
#>           F6
#>
Visualizing
Currently two summary visualizations are implemented in tidyproteomics.
Counts
In a simple grouped barchart, proteins (individual, and groups) as well as peptides (all, unique) are displayed with the match-between-runs shown as the margin above the ms2 evidenced identifications.
hela_proteins %>% plot_counts()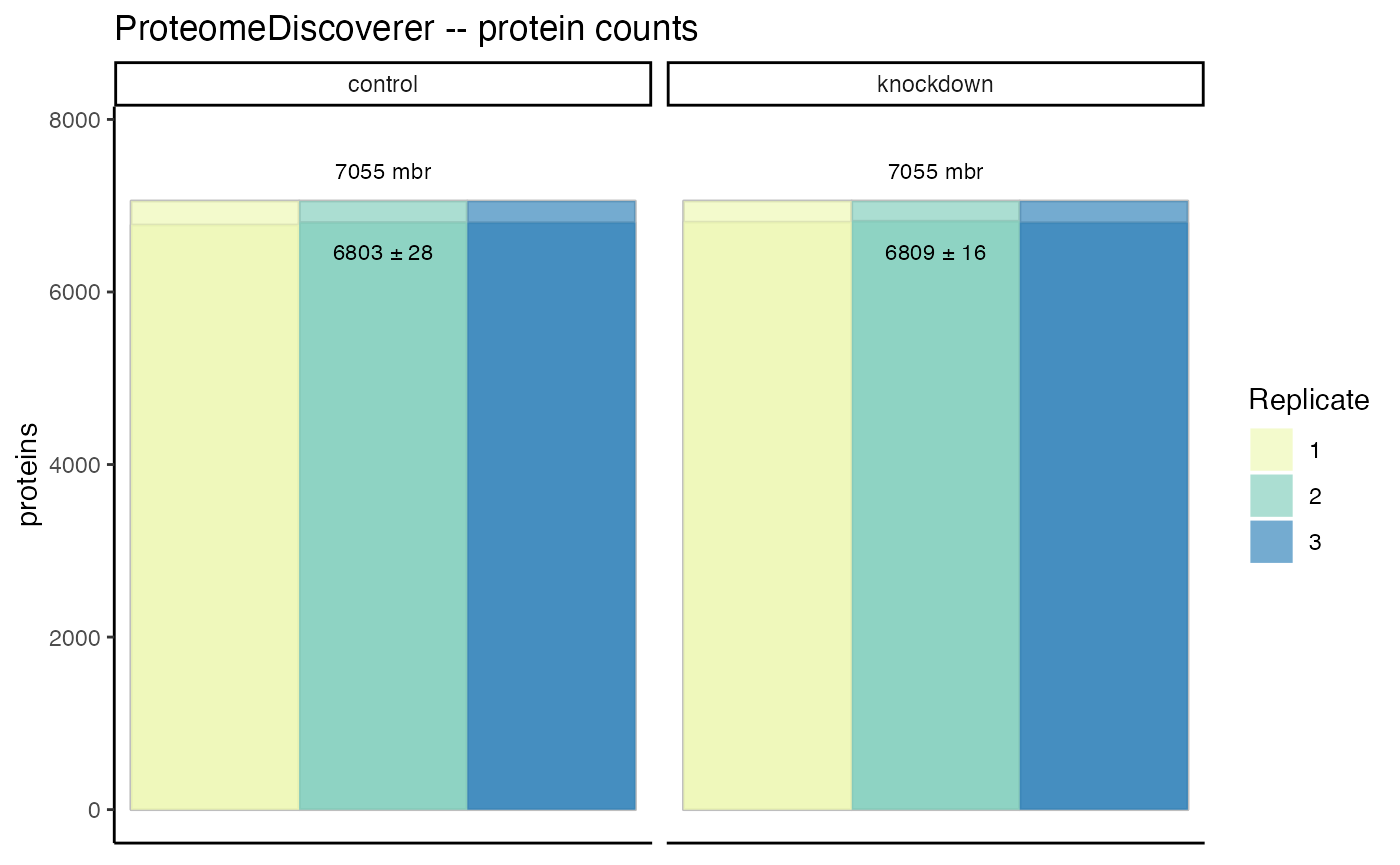
Quantitation
In recent literature a summary of protein quantitation has been visualized as a rank-based dot-plot.
hela_proteins %>% plot_quantrank()
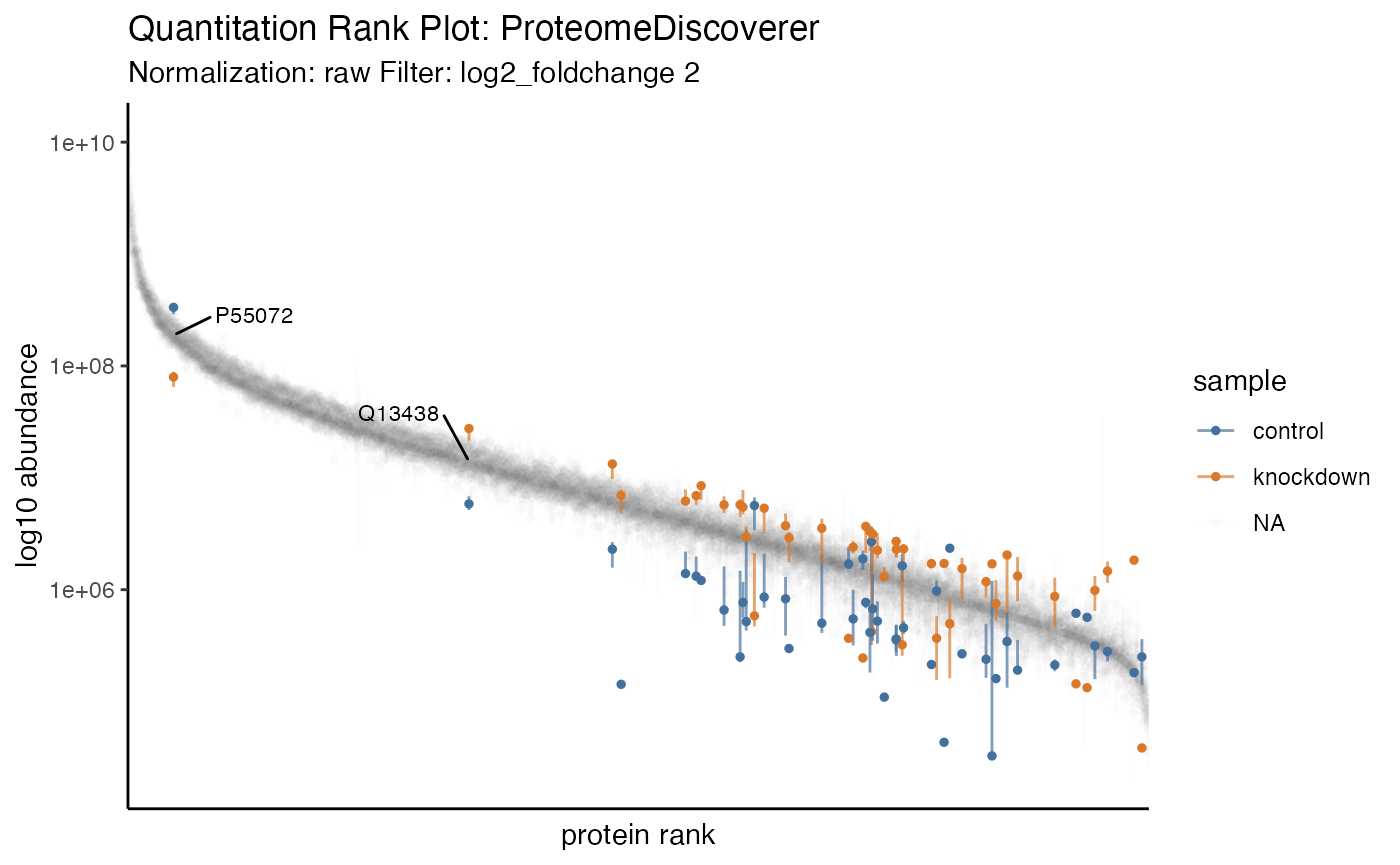
Additionally, this plot can be extended to highlight statistical differences via an unbiased all-pair-wise comparison, to give an anticipated view of how to guide downstream analyses.
hela_proteins %>% plot_quantrank(display_filter = 'log2_foldchange', display_cutoff = 2)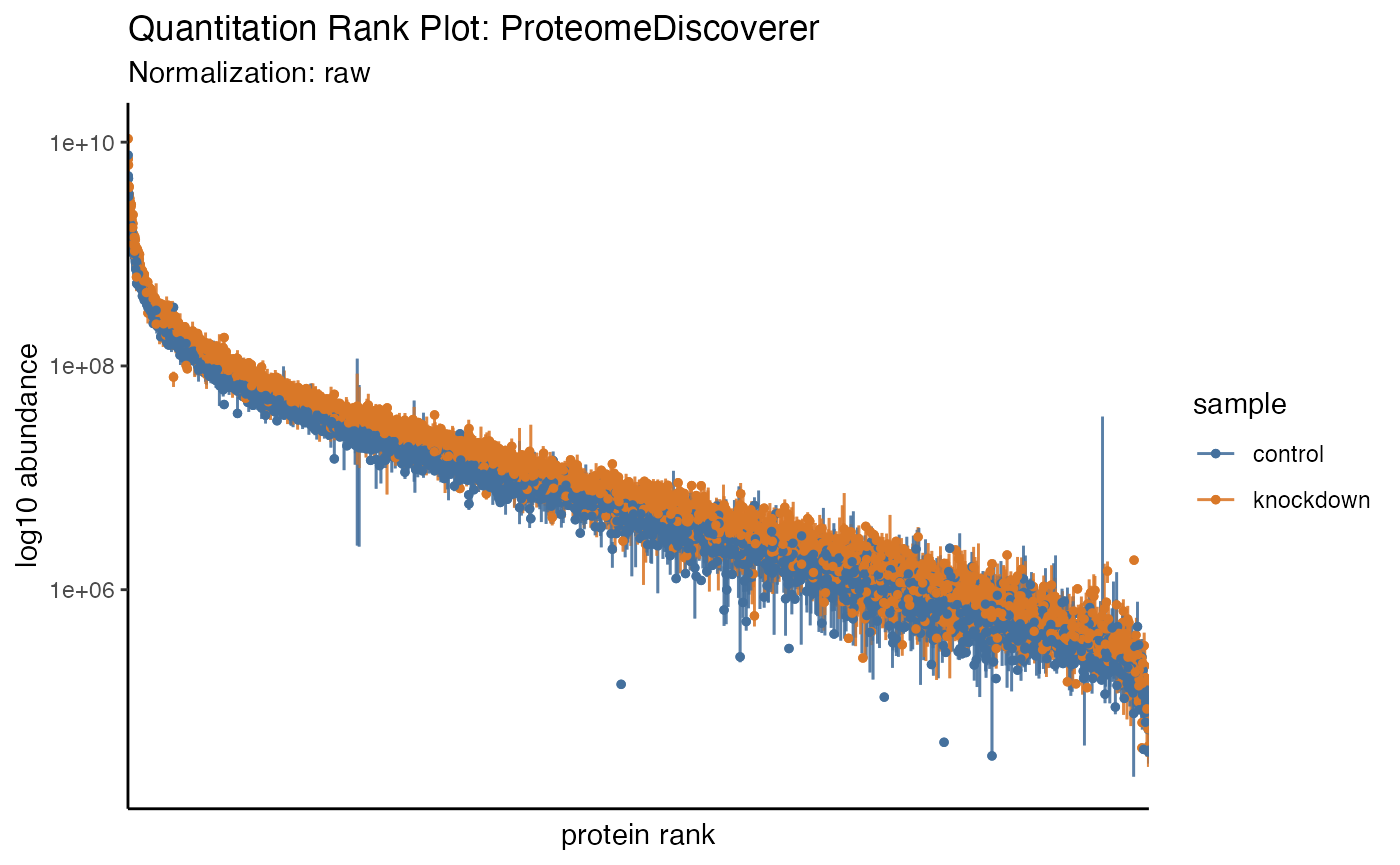
Filter to limit to the range c(low, high) and display
the protein ids.
hela_proteins %>% plot_quantrank(show_rank_scale = TRUE, limit_rank = c(1,25))