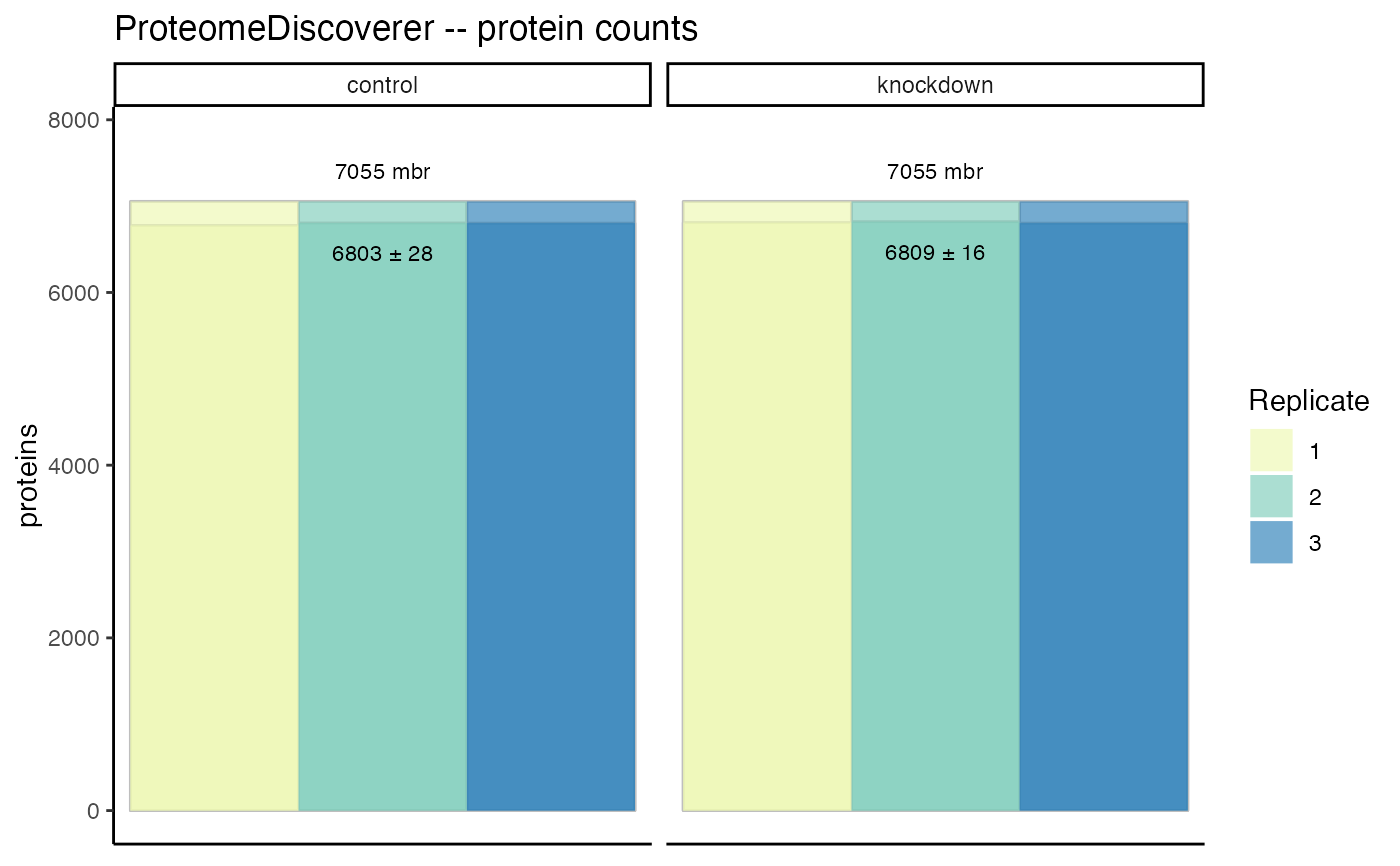
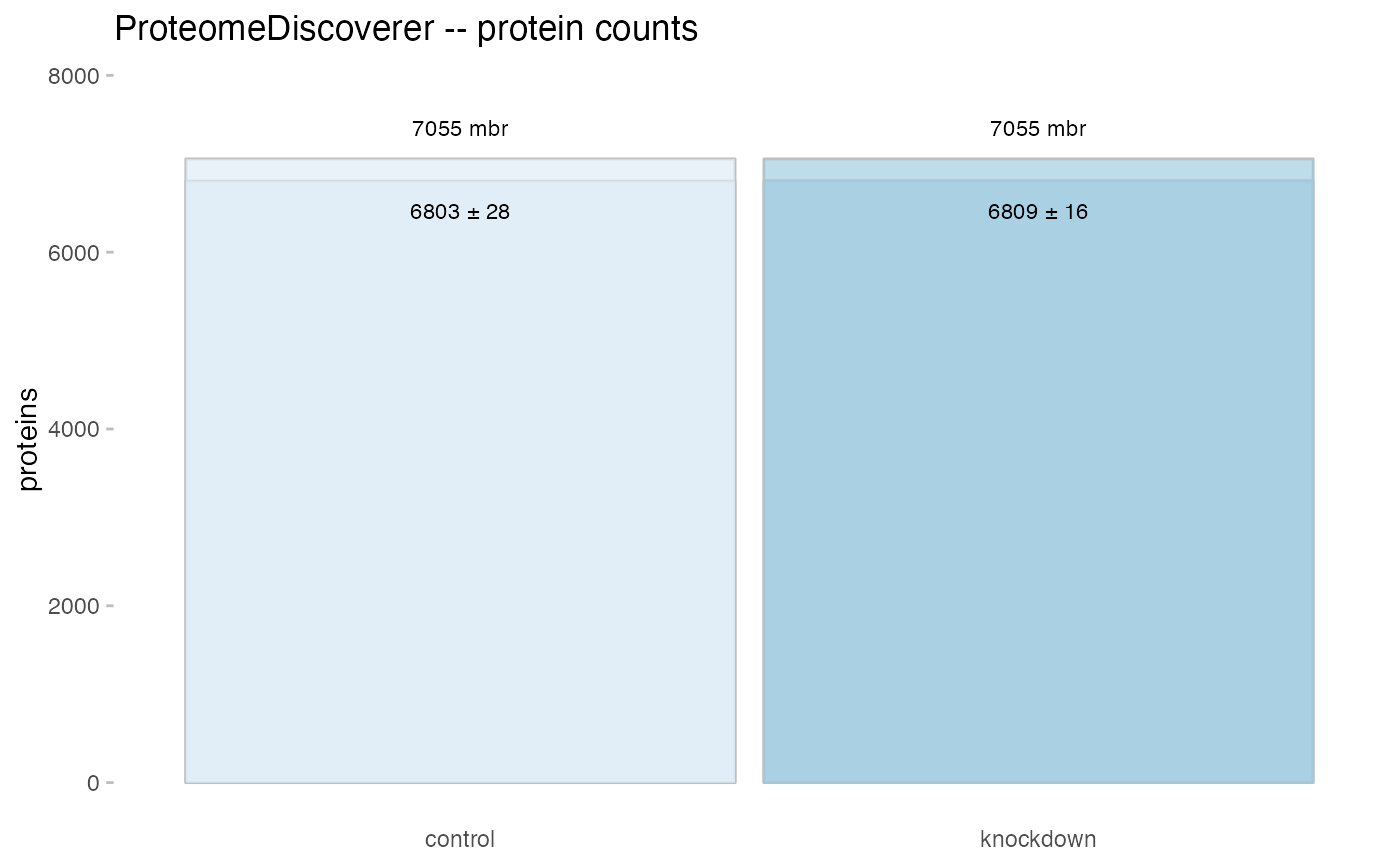
Plot the accounting of proteins. peptides, and other counts
plot_counts.Rdplot_counts() is a GGplot2 implementation for plotting counting statistics.
Usage
plot_counts(
  data = NULL,
  accounting = NULL,
  show_replicates = TRUE,
  impute_max = 0.5,
  palette = "YlGnBu",
  ...
)
Arguments
- data
tidyproteomics data object
- accounting
character string
- show_replicates
boolean to visualize replicates
- impute_max
a numeric representing the largest allowable imputation percentage
- palette
a string representing the palette for scale_fill_brewer()
- ...
passthrough for ggsave see
plotting