Plot protein expression differences
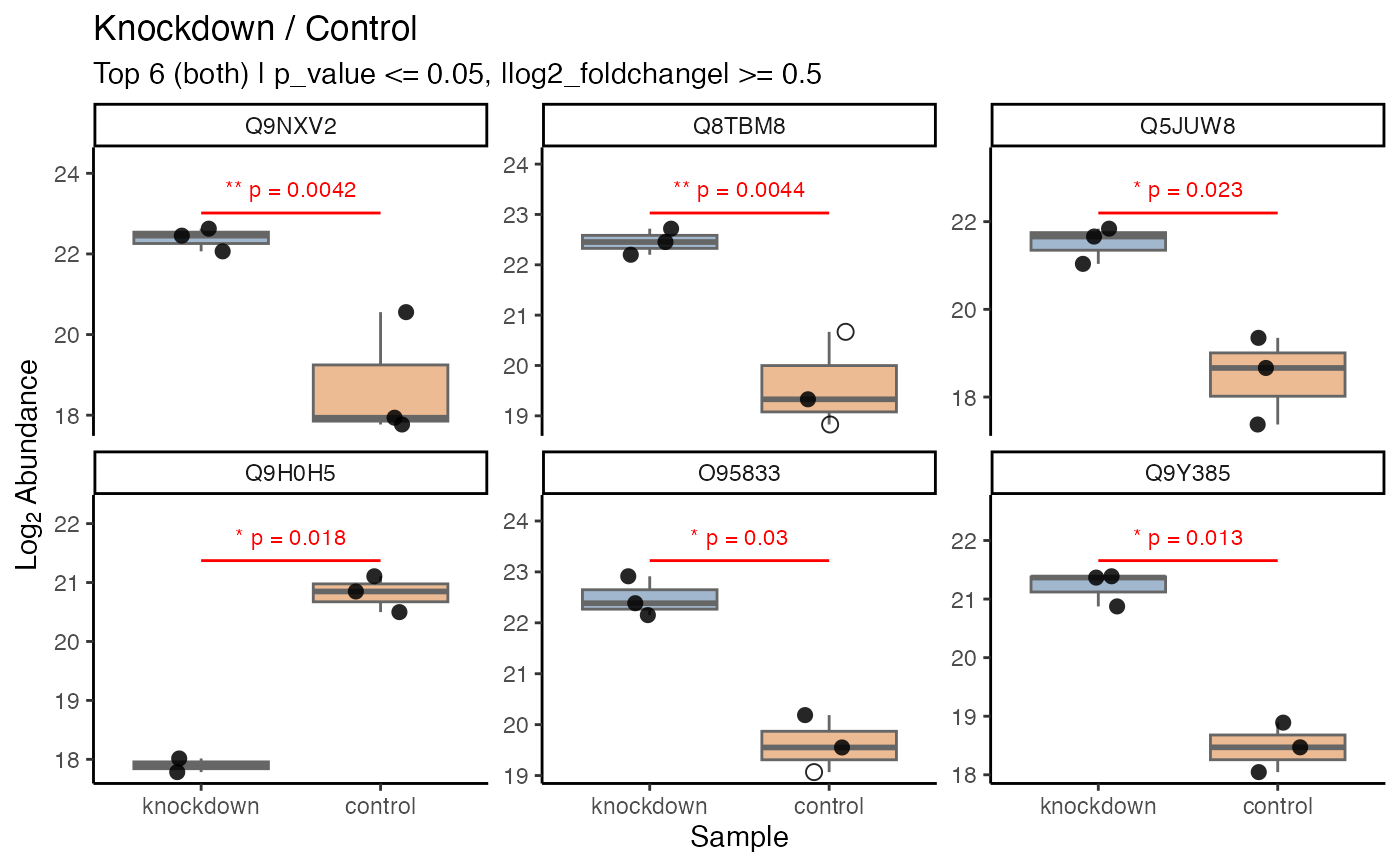
plot_expression.Rdplot_expression() is a ggplot2 implementation for visualizing protein abundance
distributions across two sample conditions for top differentially expressed proteins.
The resulting plot is faceted by protein/annotation label, with the two samples
on the x-axis, log2 abundance on the y-axis, a boxplot representing the distribution,
and individual replicate points overlaid (filled circle for non-imputed, hollow circle
for imputed).
Usage
plot_expression(
  data = NULL,
  ...,
  log2fc_min = 1,
  log2fc_column = "log2_foldchange",
  significance_max = 0.05,
  significance_column = "adj_p_value",
  top_n = 10,
  regulation = c("both", "up", "down"),
  labels_column = "protein",
  show_title = TRUE,
  destination = "plot",
  height = 6,
  width = 8
)
Arguments
- data
a tidyproteomics data object
- ...
two sample comparison expression (e.g.
knockdown/control)- log2fc_min
a numeric defining the minimum log2 foldchange threshold. Default is 1.
- log2fc_column
a character defining the column name of log2 foldchange values.
- significance_max
a numeric defining the maximum significance threshold. Default is 0.05.
- significance_column
a character defining the column name of significance values.
- top_n
an integer defining the top N proteins to plot post-filtering. Default is 10.
- regulation
a character defining direction:
"both"(default),"up", or"down".- labels_column
a character defining the annotation column for facet titles (default is
"protein").- show_title
input FALSE, TRUE for an auto-generated title or any character string.
- destination
a character string (
"plot","save","png","svg","tiff","jpeg").- height
a numeric plot height in inches. Default is 6.
- width
a numeric plot width in inches. Default is 8.
Examples
library(dplyr, warn.conflicts = FALSE)
library(tidyproteomics)

hela_proteins %>%
  expression(knockdown/control) %>%
  plot_expression(knockdown/control, log2fc_min = 0.5, significance_column = "p_value", top_n = 6)
#> ℹ .. expression::t_test testing knockdown / control
#> ✔ .. expression::t_test testing knockdown / control [3.2s]
#>
#> # A tibble: 6 × 34
#>   plot_label min_y max_y protein imputed     n imputed_control imputed_knockdown
#>   <fct>      <dbl> <dbl> <chr>     <dbl> <int>           <dbl>             <dbl>
#> 1 Q9NXV2      17.8  22.6 Q9NXV2    0         6           0                     0
#> 2 Q8TBM8      18.8  22.7 Q8TBM8    0.333     6           0.667                 0
#> 3 Q5JUW8      17.4  21.8 Q5JUW8    0         6           0                     0
#> 4 Q9H0H5      17.8  21.1 Q9H0H5    0         6           0                     0
#> 5 O95833      19.1  22.9 O95833    0.167     6           0.333                 0
#> 6 Q9Y385      18.0  21.4 Q9Y385    0         6           0                     0
#> # ℹ 26 more variables: average_expression <dbl>, proportional_expression <dbl>,
#> #   foldchange <dbl>, log2_foldchange <dbl>, p_value <dbl>, adj_p_value <dbl>,
#> #   normalization <chr>, abundance_control_1 <dbl>, abundance_control_2 <dbl>,
#> #   abundance_control_3 <dbl>, abundance_knockdown_1 <dbl>,
#> #   abundance_knockdown_2 <dbl>, abundance_knockdown_3 <dbl>,
#> #   description <chr>, biological_process <chr>, cellular_component <chr>,
#> #   molecular_function <chr>, gene_id_entrez <chr>, gene_name <chr>, …