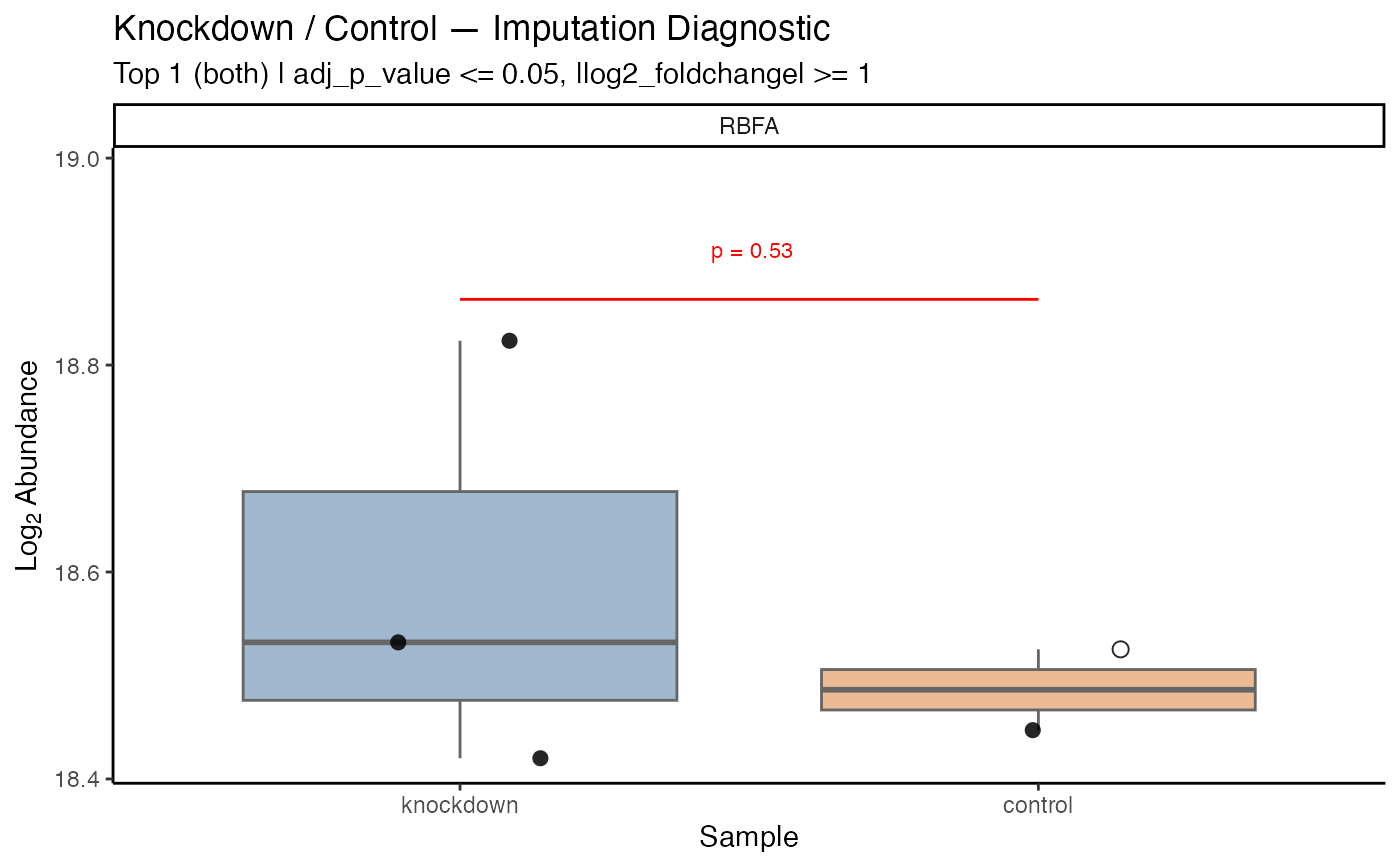
Plot Imputation Diagnostic Across Conditions
Source:R/plot_imputation_diagnostic.R
plot_imputation_diagnostic.Rdplot_imputation_diagnostic() provides a targeted quality diagnostic visual for
missing-value imputation. It visualizes individual replicate abundances across two
conditions for candidate proteins, distinguishing observed values from those imputed
(e.g. at the limit of detection). By default, it prioritizes top candidates that possess
imputed values, allowing rapid assessment of whether fold changes are continuous or
detection-limited on/off artifacts.
Usage
plot_imputation_diagnostic(
  data = NULL,
  ...,
  candidates = NULL,
  proteins = NULL,
  labels_column = "gene_name",
  top_n = 10,
  log2fc_min = 1,
  log2fc_column = "log2_foldchange",
  significance_max = 0.05,
  significance_column = "adj_p_value",
  regulation = c("both", "up", "down"),
  show_title = TRUE,
  tag = NULL,
  destination = "plot",
  height = 6,
  width = 8,
  path = NULL
)
Arguments
- data
a tidyproteomics data object
- ...
passthrough arguments.
- candidates
a character vector of protein identifiers or gene names to plot. If NULL, defaults to
proteinsor automatically selects the top candidates with imputed values.- proteins
alias for
candidatesfor backward compatibility.- labels_column
a character defining the column name for facet titles (default is
"gene_name").- top_n
integer defining the number of proteins to plot when
candidatesis NULL. Default is 10.- log2fc_column
a character defining the column name of log2 foldchange values. Default is
"log2_foldchange".- significance_column
a character defining the column name of significance values. Default is
"adj_p_value".- show_title
boolean or character string for plot title. Default is TRUE.
- tag
optional character string to append to the plot file name.
- destination
character string indicating output type:
"plot","save","png","svg","tiff","jpeg". Default is"plot".- height
numeric plot height in inches. Default is 6.
- width
numeric plot width in inches. Default is 8.
- path
optional path to save destination plot.
Examples
library(dplyr, warn.conflicts = FALSE)
library(tidyproteomics)

# subset for fast execution
hela_proteins <- hela_proteins %>% subset(description %like% "Ribosome")
#>
#> ℹ Subsetting data: description %like% Ribosome
#> ✔ Subsetting data: description %like% Ribosome ... done
#>

hela_proteins %>%
  expression(knockdown/control) %>%
  plot_imputation_diagnostic(knockdown/control, top_n = 6)
#> ℹ .. expression::t_test testing knockdown / control
#> ✔ .. expression::t_test testing knockdown / control [65ms]
#>
#> ℹ no values significant at current settings
#> ℹ ... log2_foldchange (1) and adj_p_value (0.05)
#> ℹ ... falling back to top candidates ranked by effect and significance