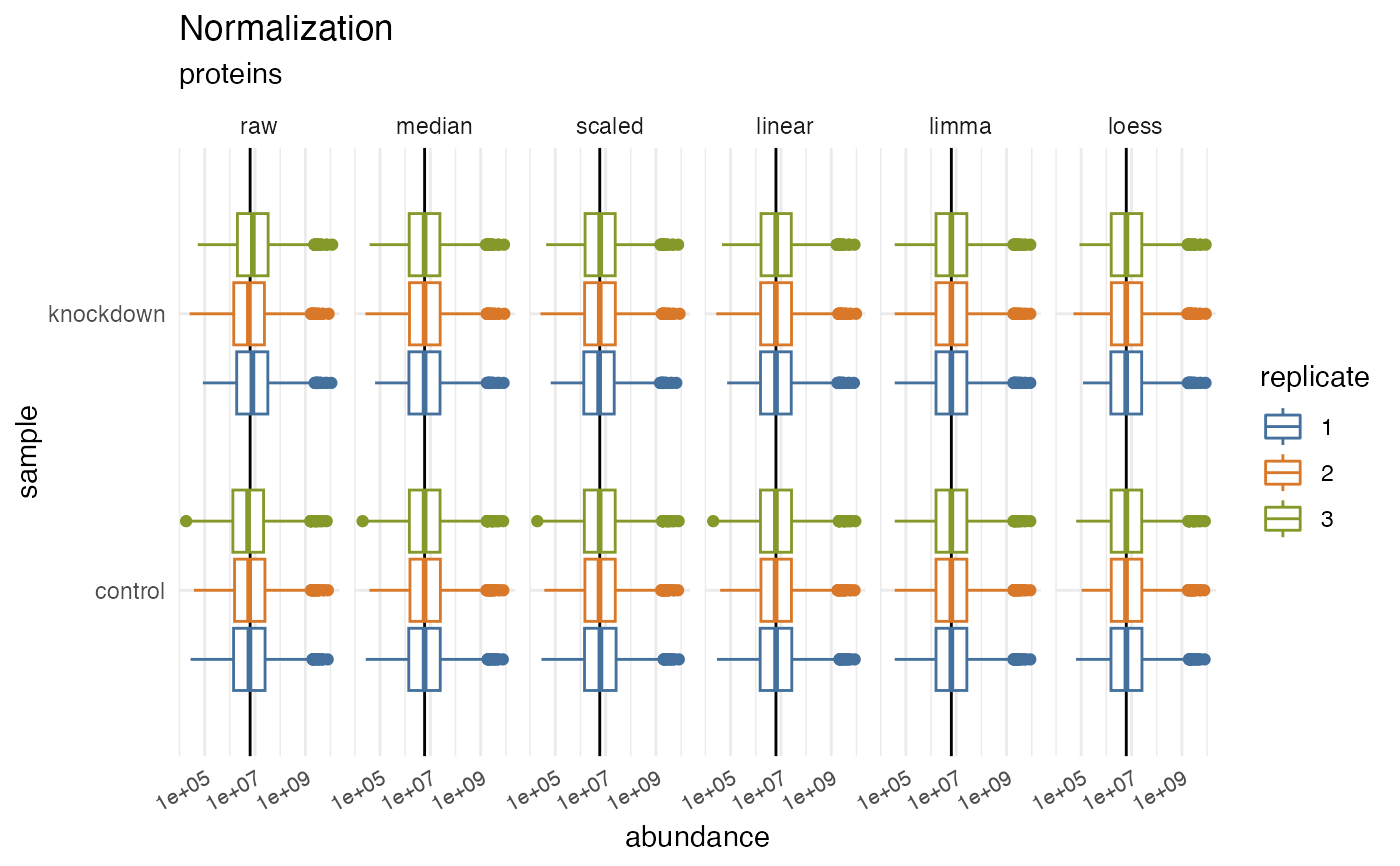
Plot normalized values
plot_normalization.Rdplot_normalization() is a GGplot2 implementation for plotting the normalization
effects visualized as a box plot.
Examples
library(dplyr, warn.conflicts = FALSE)
library(tidyproteomics)
hela_proteins %>%
  normalize(.method = c("scaled", "median", "linear", "limma", "loess")) %>%
  plot_normalization()
#> ℹ Normalizing quantitative data
#> ℹ ... using scaled shift
#> ✔ ... using scaled shift [264ms]
#>
#> ℹ ... using median shift
#> ✔ ... using median shift [132ms]
#>
#> ℹ ... using linear regression
#> ✔ ... using linear regression [211ms]
#>
#> ℹ ... using limma regression
#> ✔ ... using limma regression [375ms]
#>
#> ℹ ... using loess regression
#> ✔ ... using loess regression [1.2s]
#>
#> ℹ Selecting best normalization method
#> ✔ Selecting best normalization method ... done
#>
#> ℹ  ... selected loess
#> Warning: Removed 73038 rows containing non-finite outside the scale range
#> (`stat_boxplot()`).