Plot PCA values
plot_pca.Rdplot_pca() is a GGplot2 implementation for plotting two principal components
from a PCA analysis, visualized as a scatter.
Usage
plot_pca(
  data = NULL,
  variables = c("PC1", "PC2"),
  labels = TRUE,
  label_size = 3,
  ...
)
Arguments
- data
tidyproteomics data object
- variables
a character vector of the 2 PCs to plot. Acceptable values include (PC1, PC2, PC3 ... PC9). Default c('PC1','PC2').
- labels
a boolean
- label_size
a numeric
- ...
passthrough for ggsave see
plotting
Examples
library(dplyr, warn.conflicts = FALSE)
library(tidyproteomics)
hela_proteins <- hela_proteins %>%
normalize(.method = c("scaled", "median", "linear", "limma", "loess")) %>%
select_normalization()
#> ℹ Normalizing quantitative data
#> ℹ ... using scaled shift
#> ✔ ... using scaled shift [132ms]
#>
#> ℹ ... using median shift
#> ✔ ... using median shift [129ms]
#>
#> ℹ ... using linear regression
#> ✔ ... using linear regression [217ms]
#>
#> ℹ ... using limma regression
#> ✔ ... using limma regression [388ms]
#>
#> ℹ ... using loess regression
#> ✔ ... using loess regression [1.3s]
#>
#> ℹ Selecting best normalization method
#> ✔ Selecting best normalization method ... done
#>
#> ℹ ... selected loess
#> ℹ Selecting best normalization method
#> ✔ Selecting best normalization method ... done
#>
#> ℹ ... selected loess
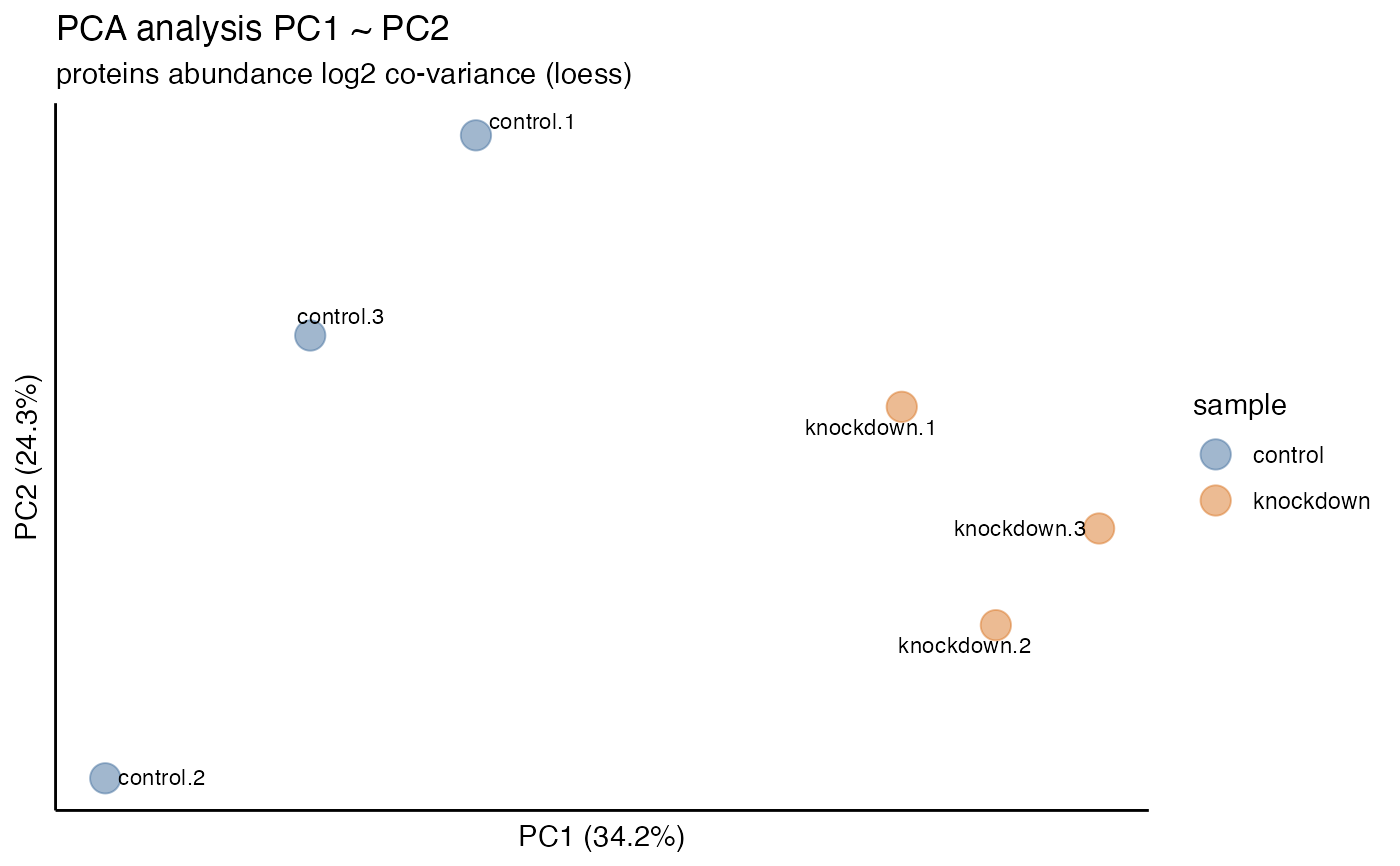
hela_proteins %>% plot_pca()
 # a different PC set
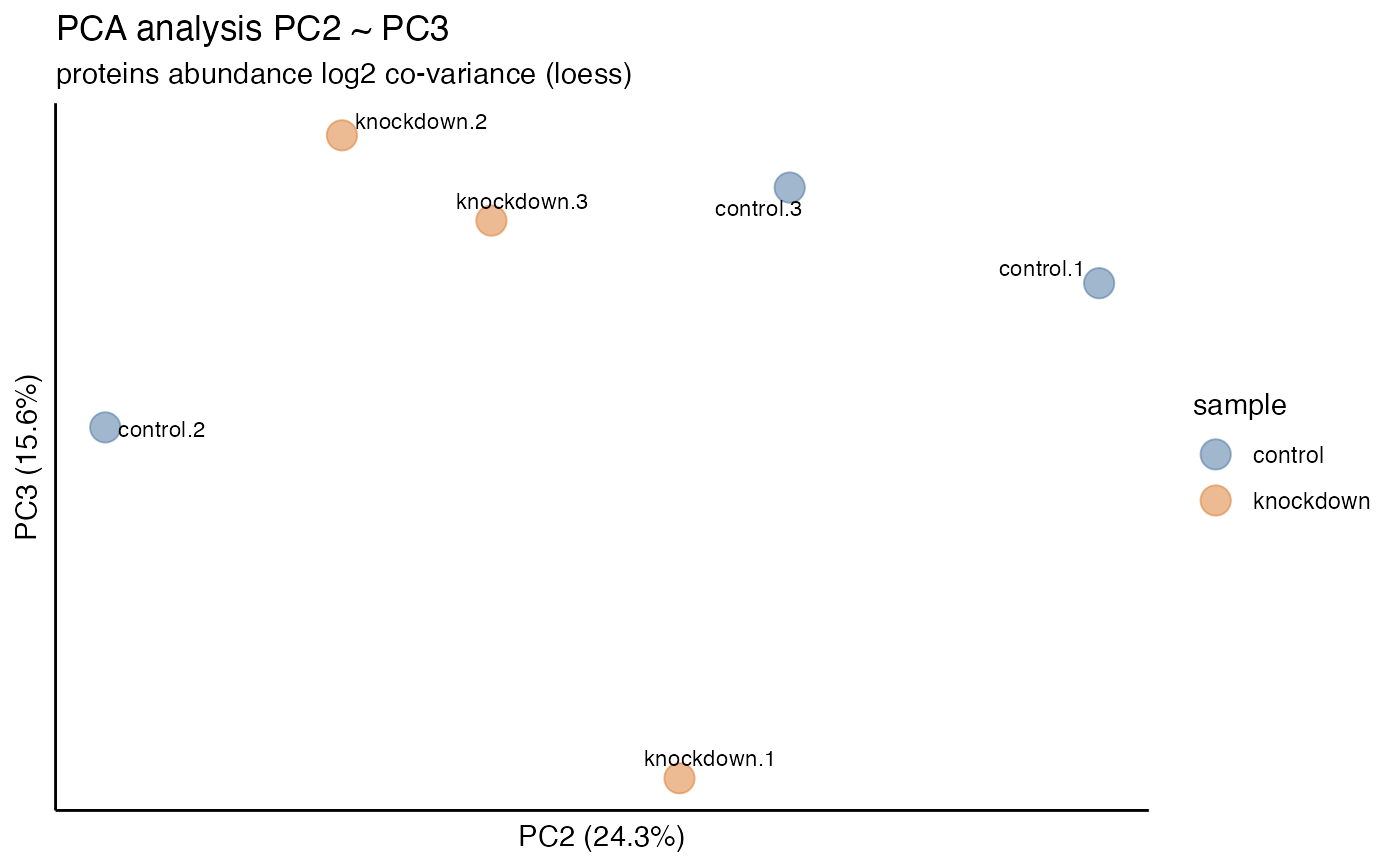
hela_proteins %>% plot_pca(variables = c("PC2", "PC3"))
# a different PC set
hela_proteins %>% plot_pca(variables = c("PC2", "PC3"))
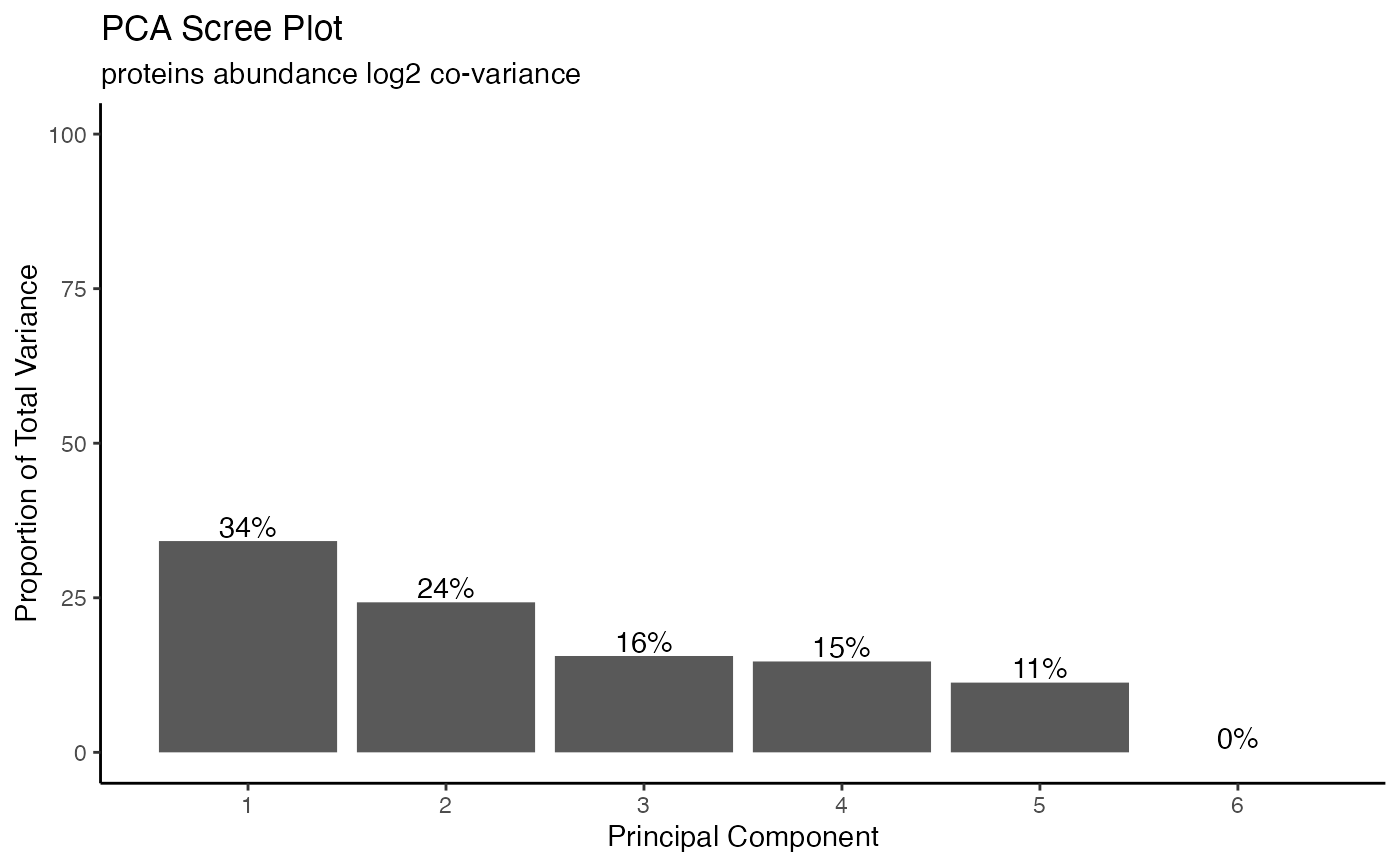
 # a PC scree plot
hela_proteins %>% plot_pca("scree")
# a PC scree plot
hela_proteins %>% plot_pca("scree")