Visualize mapped sequence data
plot_protein.RdVisualize mapped sequence data
Usage
plot_protein(
  mapped_data = NULL,
  protein = NULL,
  row_length = 50,
  samples = NULL,
  modifications = NULL,
  ncol = NULL,
  nrow = NULL,
  color_sequence = "grey60",
  color_modifications = c("red", "blue", "orange", "skyblue", "purple", "yellow"),
  show_modification_precent = TRUE
)
Arguments
- mapped_data
a tidyproteomics data-object, specifically of sequencing origin
- protein
a character string
- row_length
a numeric
- samples
a character string
- modifications
a character string
- ncol
a numeric
- nrow
a numeric
- color_sequence
a character string
- color_modifications
a character vector
- show_modification_precent
a boolean
Examples
library(dplyr, warn.conflicts = FALSE)
library(tidyproteomics)
hela_protein_map <- hela_peptides %>%
protein_map(fasta = path_to_package_data('fasta'))
#> ℹ Parsing FASTA file human.fasta
#> ✔ Parsing FASTA file human.fasta ... done
#>
#> ℹ Sequence mapping
#> Sequence mapping ■■■■■■■■■ 25% | ETA: 7s
#> Sequence mapping ■■■■■■■■■■■■■■■■■■■■■■■ 75% | ETA: 2s
#> Sequence mapping ■■■■■■■■■■■■■■■■■■■■■■■■■■■■■■■ 100% | ETA: 0s
#> ℹ Sequence mapping
#> ✔ Sequence mapping ... done
#>
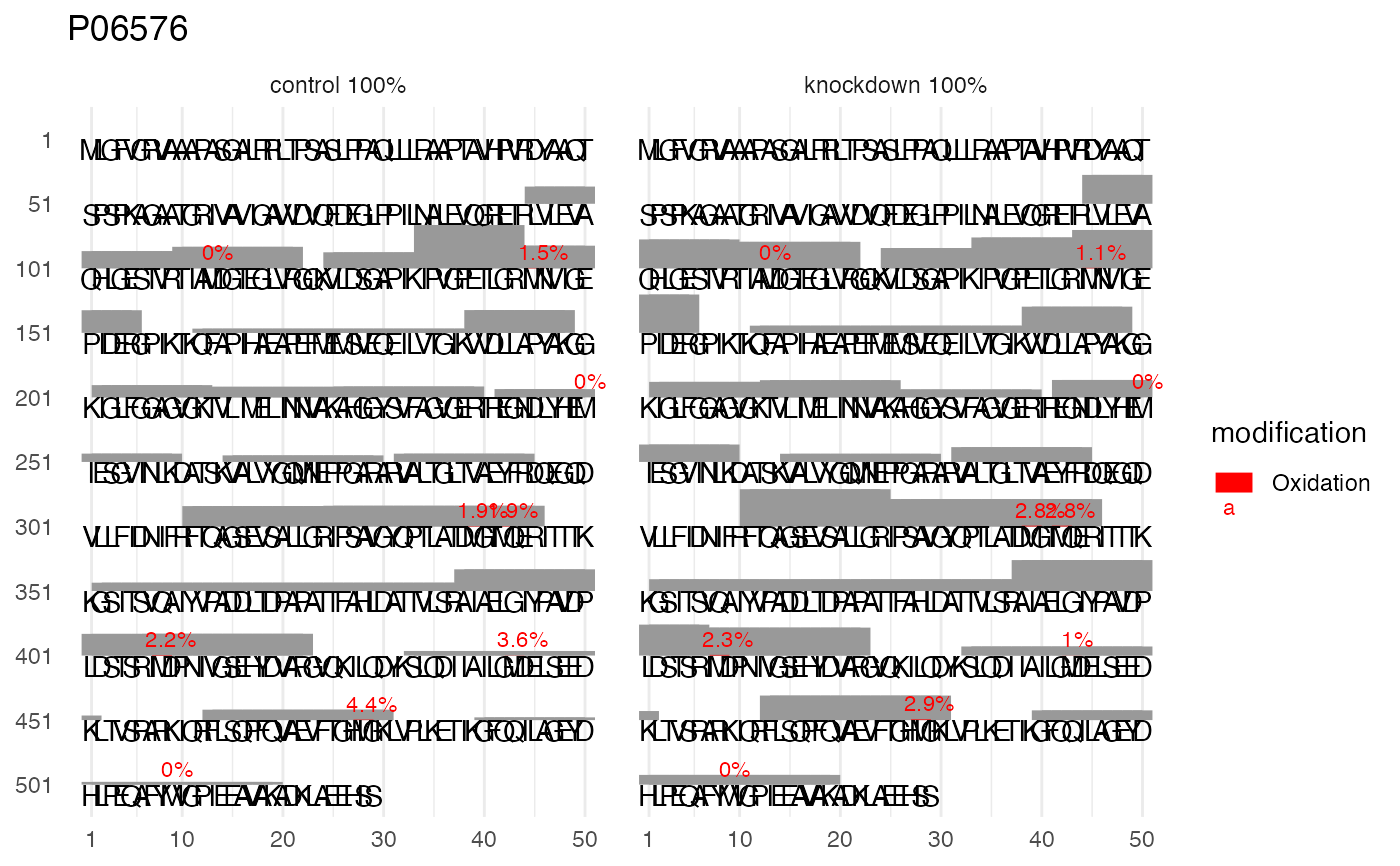
hela_protein_map %>% plot_protein('P06576')