Plot the variation in normalized values
plot_quantrank.Rdplot_quantrank() is a GGplot2 implementation for plotting the variability in
normalized values, generating two facets. The left facet is a plot of CVs for
each normalization method. The right facet is a plot of the 95%CI in abundance,
essentially the conservative dynamic range. The goal is to select a normalization
method that minimizes CVs while also retaining the dynamic range.
Arguments
- data
tidyproteomics data object
- accounting
character string
- type
character string
- show_error
a boolean
- show_rank_scale
a boolean
- limit_rank
a numerical vector of 2
- display_subset
a string vector of identifiers to highlight
- display_filter
a numeric between 0 and 1
- display_cutoff
a numeric between 0 and 1
- palette
a string representing the palette for scale_fill_brewer()
- impute_max
a numeric representing the largest allowable imputation percentage
- ...
passthrough for ggsave see
plotting
Examples
library(dplyr, warn.conflicts = FALSE)
library(tidyproteomics)
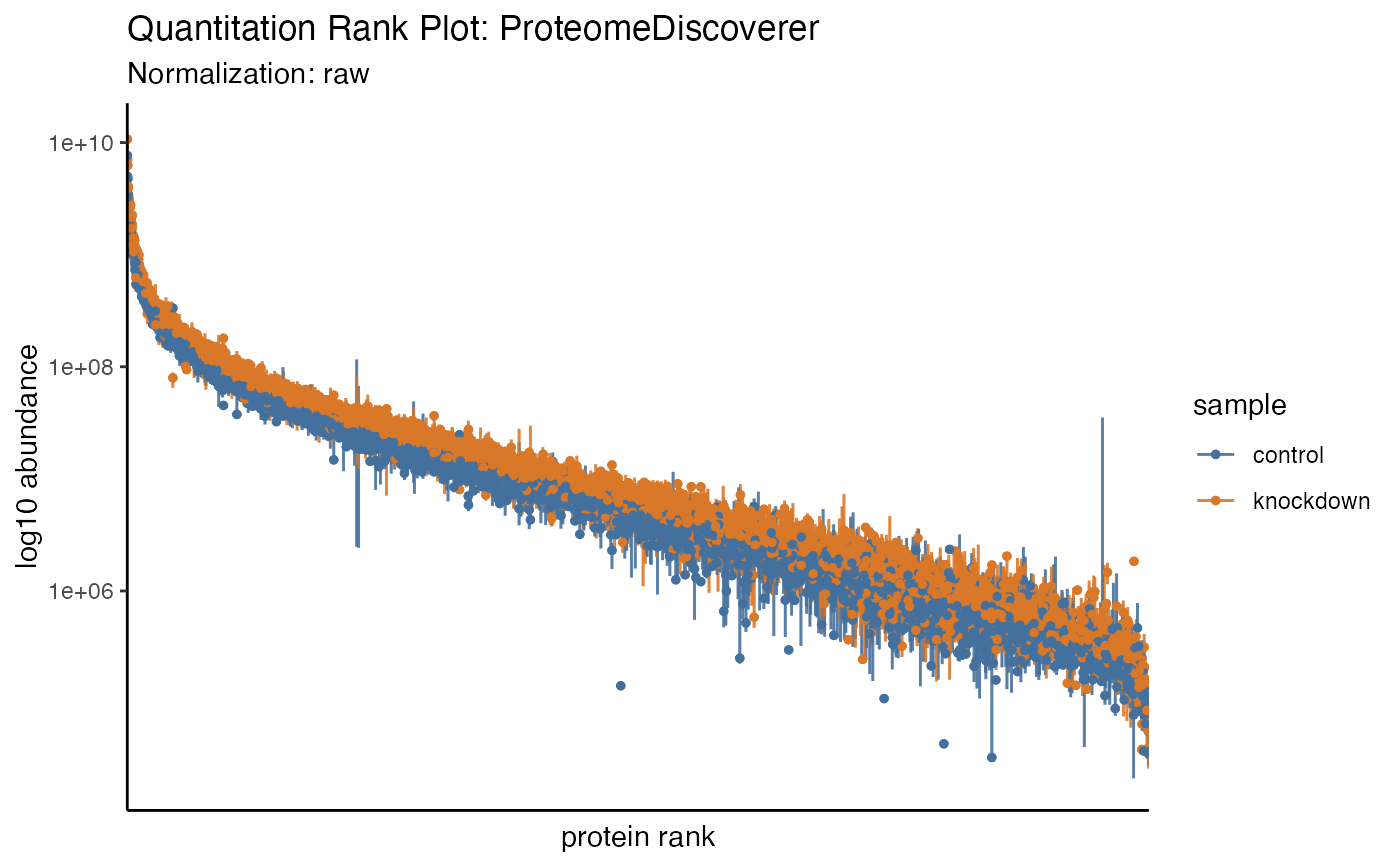
hela_proteins %>% plot_quantrank()
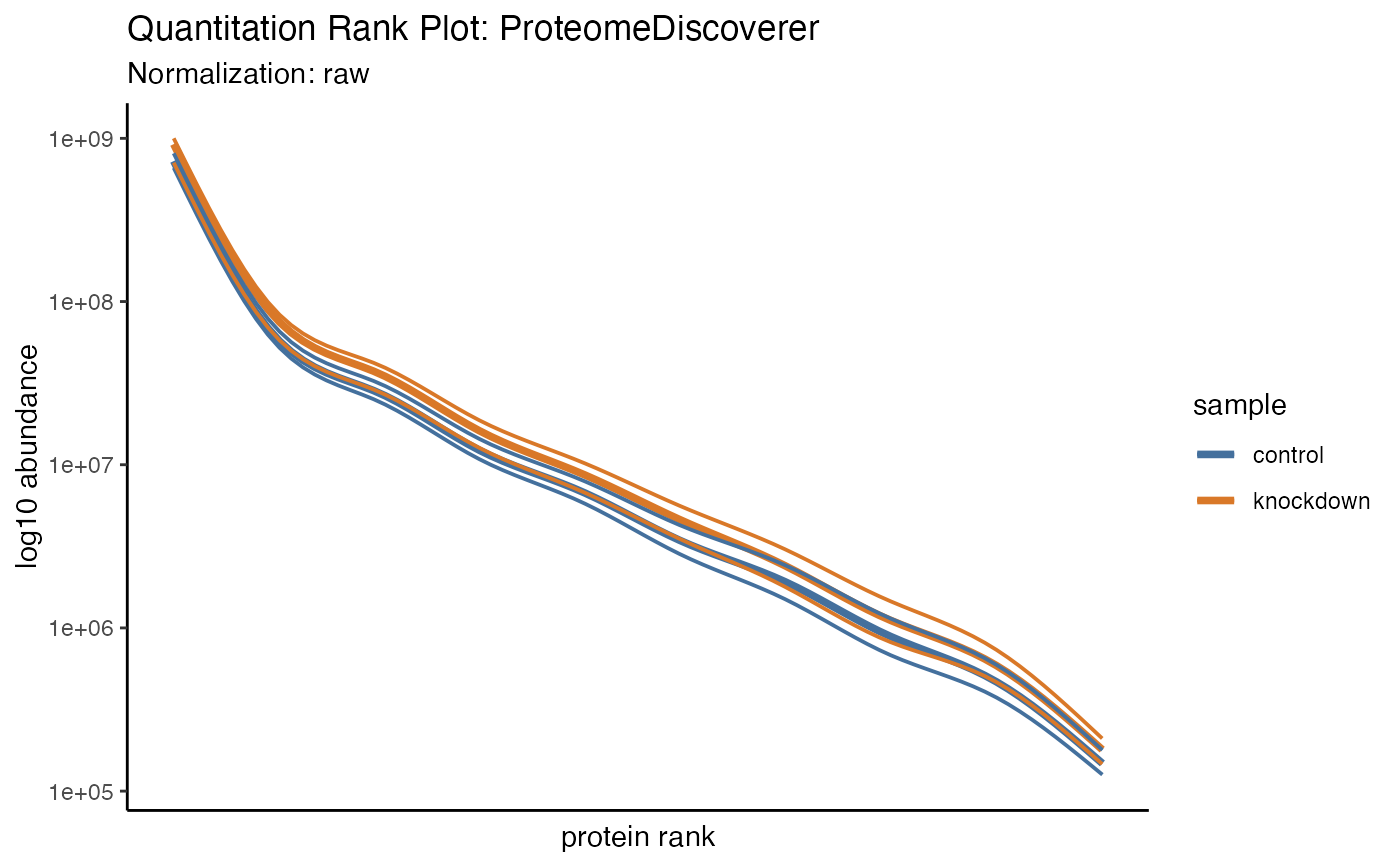
 hela_proteins %>% plot_quantrank(type = "lines")
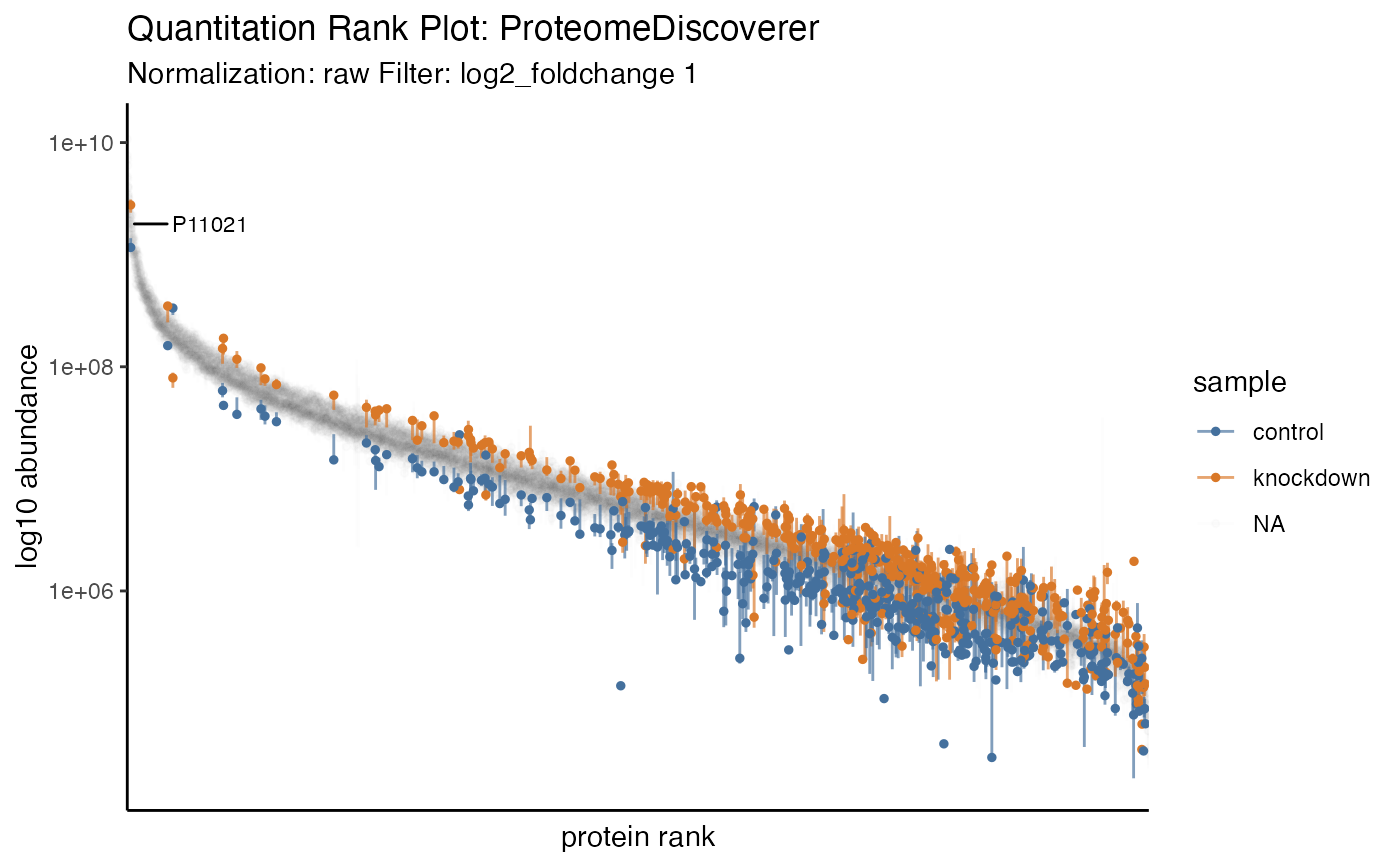
 hela_proteins %>% plot_quantrank(display_filter = "log2_foldchange", display_cutoff = 1)
#> Warning: There were 1868 warnings in `dplyr::summarise()`.
#> The first warning was:
#> ℹ In argument: `log2_foldchange = max(log2_foldchange, na.rm = TRUE)`.
#> ℹ In group 6: `identifier = "A0A075B6E5"`.
#> Caused by warning in `max()`:
#> ! no non-missing arguments to max; returning -Inf
#> ℹ Run `dplyr::last_dplyr_warnings()` to see the 1867 remaining warnings.
#> Warning: ggrepel: 414 unlabeled data points (too many overlaps). Consider increasing max.overlaps
hela_proteins %>% plot_quantrank(display_filter = "log2_foldchange", display_cutoff = 1)
#> Warning: There were 1868 warnings in `dplyr::summarise()`.
#> The first warning was:
#> ℹ In argument: `log2_foldchange = max(log2_foldchange, na.rm = TRUE)`.
#> ℹ In group 6: `identifier = "A0A075B6E5"`.
#> Caused by warning in `max()`:
#> ! no non-missing arguments to max; returning -Inf
#> ℹ Run `dplyr::last_dplyr_warnings()` to see the 1867 remaining warnings.
#> Warning: ggrepel: 414 unlabeled data points (too many overlaps). Consider increasing max.overlaps
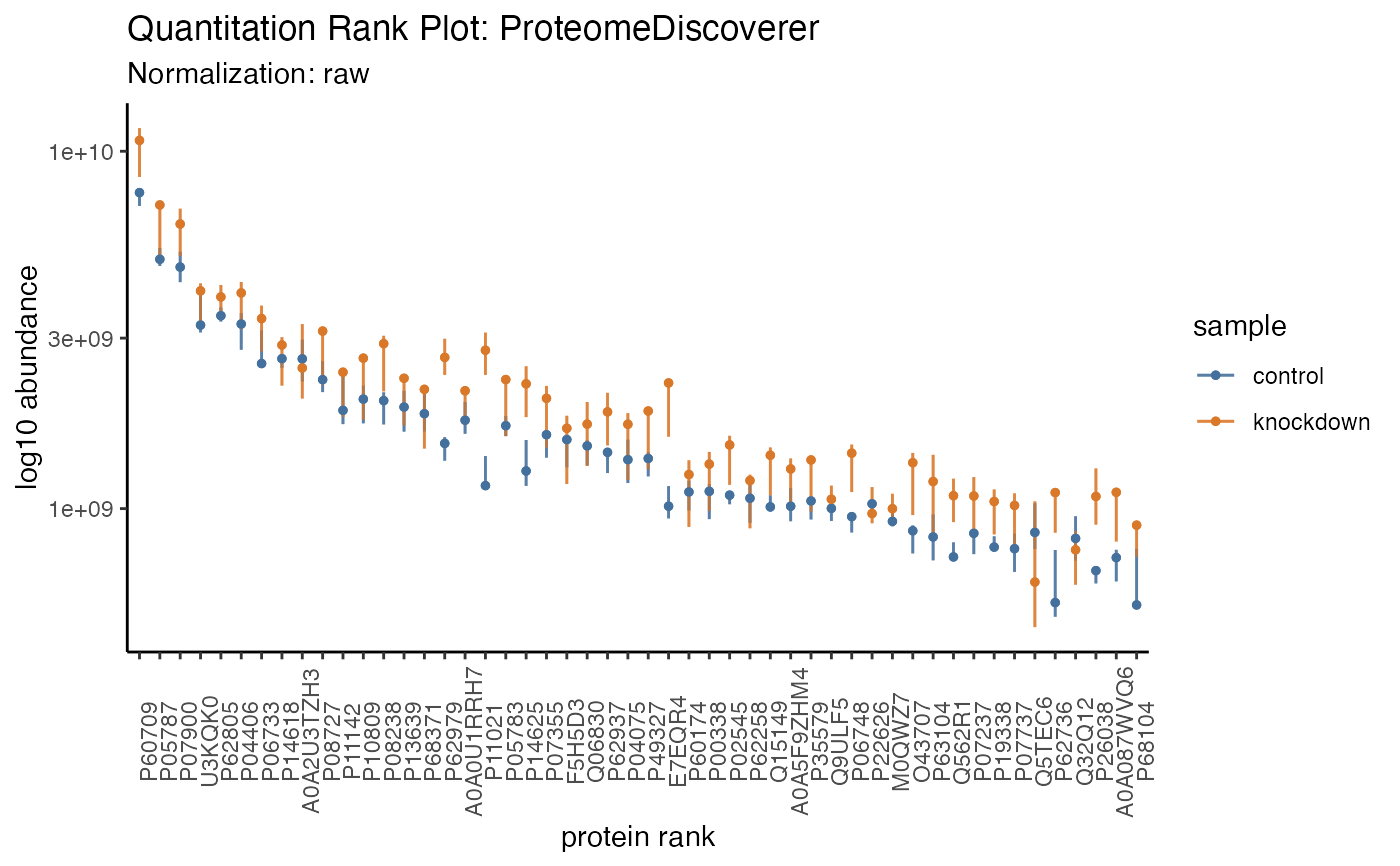
 hela_proteins %>% plot_quantrank(limit_rank = c(1,50), show_rank_scale = TRUE)