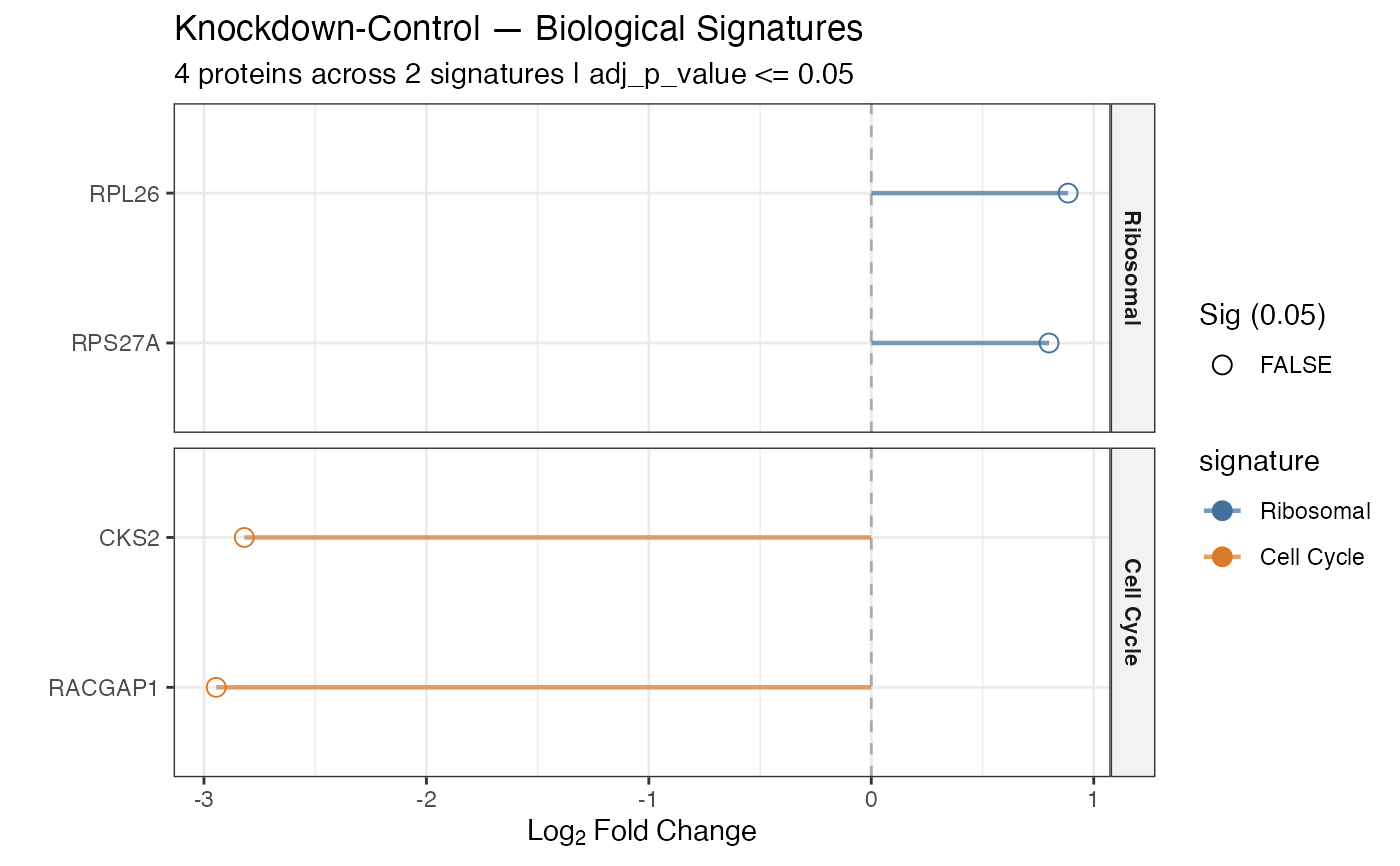
plot_signatures() visualizes directional expression shifts across distinct
biological modules, pathways, or opposing signatures (e.g., comparing upregulated
quality control machinery against downregulated cell-cycle/growth machinery)
as a faceted, diverging lollipop or bar chart.
Usage
plot_signatures(
  data = NULL,
  ...,
  signatures = NULL,
  programs = NULL,
  set_a = NULL,
  set_b = NULL,
  label_a = "Signature A",
  label_b = "Signature B",
  labels_column = "gene_name",
  log2fc_column = "log2_foldchange",
  significance_column = "adj_p_value",
  significance_max = 0.05,
  plot_type = c("lollipop", "bar"),
  show_title = TRUE,
  tag = NULL,
  destination = "plot",
  height = 6,
  width = 8,
  path = NULL
)

plot_programs(...)
Arguments
- data
a tidyproteomics data object (or an exported expression table)
- ...
two sample comparison expression (e.g.
knockdown/control)- signatures
a named list of character vectors of identifiers/gene names representing distinct biological signatures or programs (e.g.
list("UPR" = c(...), "CellCycle" = c(...))).- programs
alias for
signaturesfor backward compatibility.- set_a
optional convenience parameter for the first program gene set (used if
signaturesis NULL).- set_b
optional convenience parameter for the second program gene set (used if
signaturesis NULL).- label_a
character label for
set_a. Default is "Signature A".- label_b
character label for
set_b. Default is "Signature B".- labels_column
a character defining the column name for feature labeling. Default is "gene_name".
- log2fc_column
a character defining the column name of log2 foldchange values. Default is "log2_foldchange".
- significance_column
a character defining the column name of significance values. Default is "adj_p_value".
- significance_max
a numeric defining the significance threshold. Default is 0.05.
- plot_type
character defining geometry type, either "lollipop" (default) or "bar".
- show_title
boolean or character string for plot title. Default is TRUE.
- tag
optional character string to append to the plot file name.
- destination
character string indicating output type: "plot", "save", "png", "svg", "tiff", "jpeg". Default is "plot".
- height
numeric plot height in inches. Default is 6.
- width
numeric plot width in inches. Default is 8.
- path
optional path to save destination plot.
Examples
library(dplyr, warn.conflicts = FALSE)
library(tidyproteomics)

hela_proteins %>%
  expression(knockdown/control) %>%
  plot_signatures(
    knockdown/control,
    signatures = list(
      "Ribosomal" = c("RPL26", "RPS27A"),
      "Cell Cycle" = c("CKS2", "RACGAP1")
    ),
    labels_column = "gene_name"
  )
#> ℹ .. expression::t_test testing knockdown / control
#> ✔ .. expression::t_test testing knockdown / control [3.3s]
#>