Volcano plot of expression values
plot_volcano.Rdplot_volcano() is a GGplot2 implementation for plotting the expression differences
as foldchange ~ statistical significance. See also plot_proportion(). This function can
take either a tidyproteomics data object or a table with the required headers.
Usage
plot_volcano(
  data = NULL,
  ...,
  log2fc_min = 1,
  log2fc_column = "log2_foldchange",
  significance_max = 0.05,
  significance_column = "adj_p_value",
  labels_column = "gene_name",
  show_pannels = TRUE,
  show_lines = TRUE,
  show_fc_scale = TRUE,
  show_title = TRUE,
  show_pval_1 = TRUE,
  point_size = NULL,
  color_positive = "dodgerblue",
  color_negative = "firebrick1",
  destination = "plot",
  height = 5,
  width = 8
)
Arguments
- data
a tibble
- ...
two sample comparison
- log2fc_min
a numeric defining the minimum log2 foldchange to highlight.
- log2fc_column
a character defining the column name of the log2 foldchange values.
- significance_max
a numeric defining the maximum statistical significance to highlight.
- significance_column
a character defining the column name of the statistical significance values.
- labels_column
a character defining the column name of the column for labeling.
- show_pannels
a boolean for showing colored up/down expression panels.
- show_lines
a boolean for showing threshold lines.
- show_fc_scale
a boolean for showing the secondary foldchange scale.
- show_title
input FALSE, TRUE for an auto-generated title or any charcter string.
- show_pval_1
a boolean for showing expressions with pvalue == 1.
- point_size
a character reference to a numerical value in the expression table
- color_positive
a character defining the color for positive (up) expression.
- color_negative
a character defining the color for negative (down) expression.
- destination
a character string
- height
a numeric
- width
a numeric
Examples
library(dplyr, warn.conflicts = FALSE)
library(tidyproteomics)
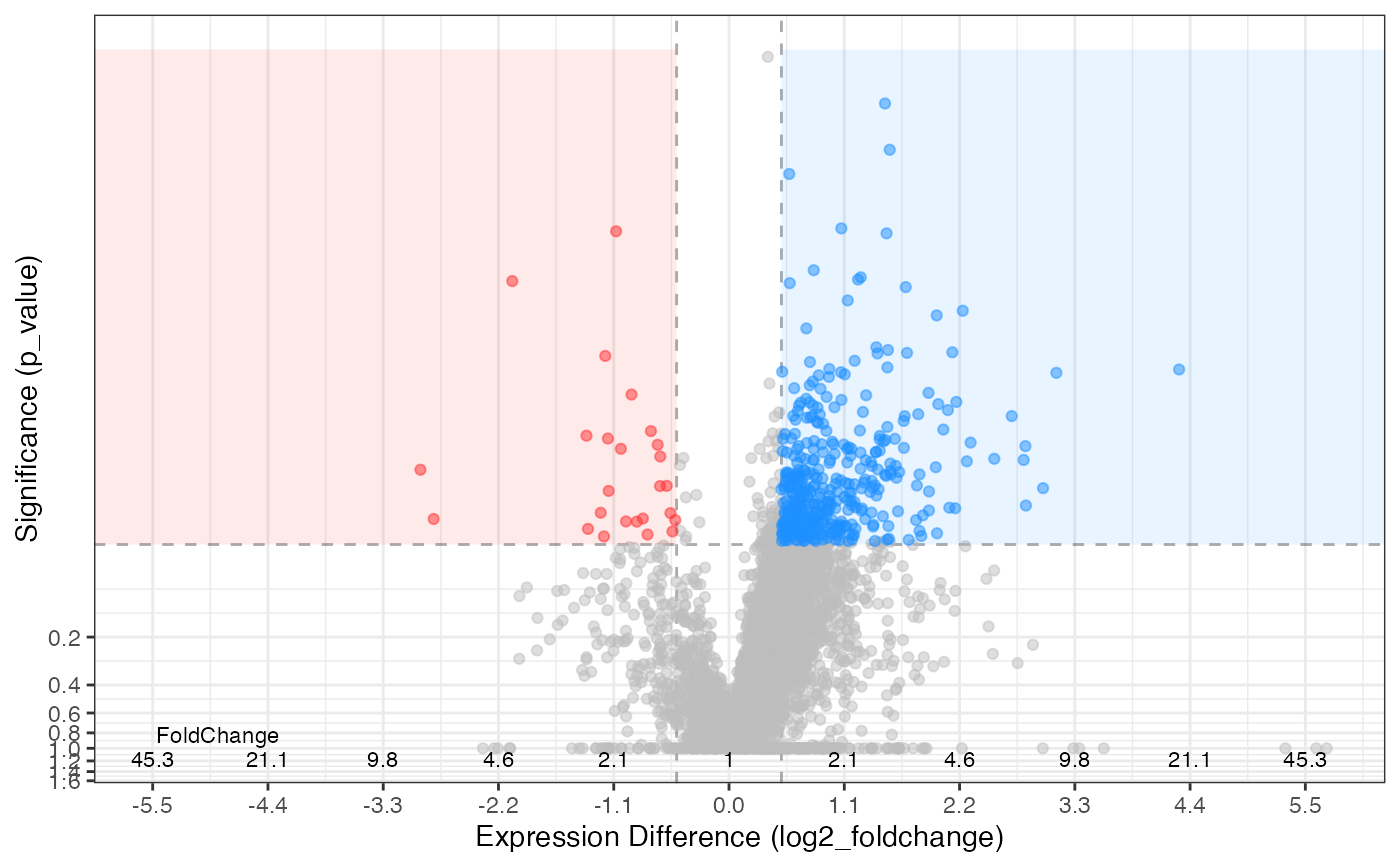
hela_proteins %>%
expression(knockdown/control) %>%
plot_volcano(knockdown/control, log2fc_min = 0.5, significance_column = "p_value")
#> ℹ .. expression::t_test testing knockdown / control
#> ✔ .. expression::t_test testing knockdown / control [3s]
#>
#> [1] 8.884161e-05 4.994106e-02
#> Warning: Removed 13 rows containing missing values or values outside the scale range
#> (`geom_text_repel()`).
#> Warning: ggrepel: 368 unlabeled data points (too many overlaps). Consider increasing max.overlaps
 # generates the same out come
# hela_proteins %>%
# expression(knockdown/control) %>%
# export_analysis(knockdown/control, .analysis = "expression") %>%
# plot_volcano(log2fc_min = 0.5, significance_column = "p_value")
# display the gene name instead
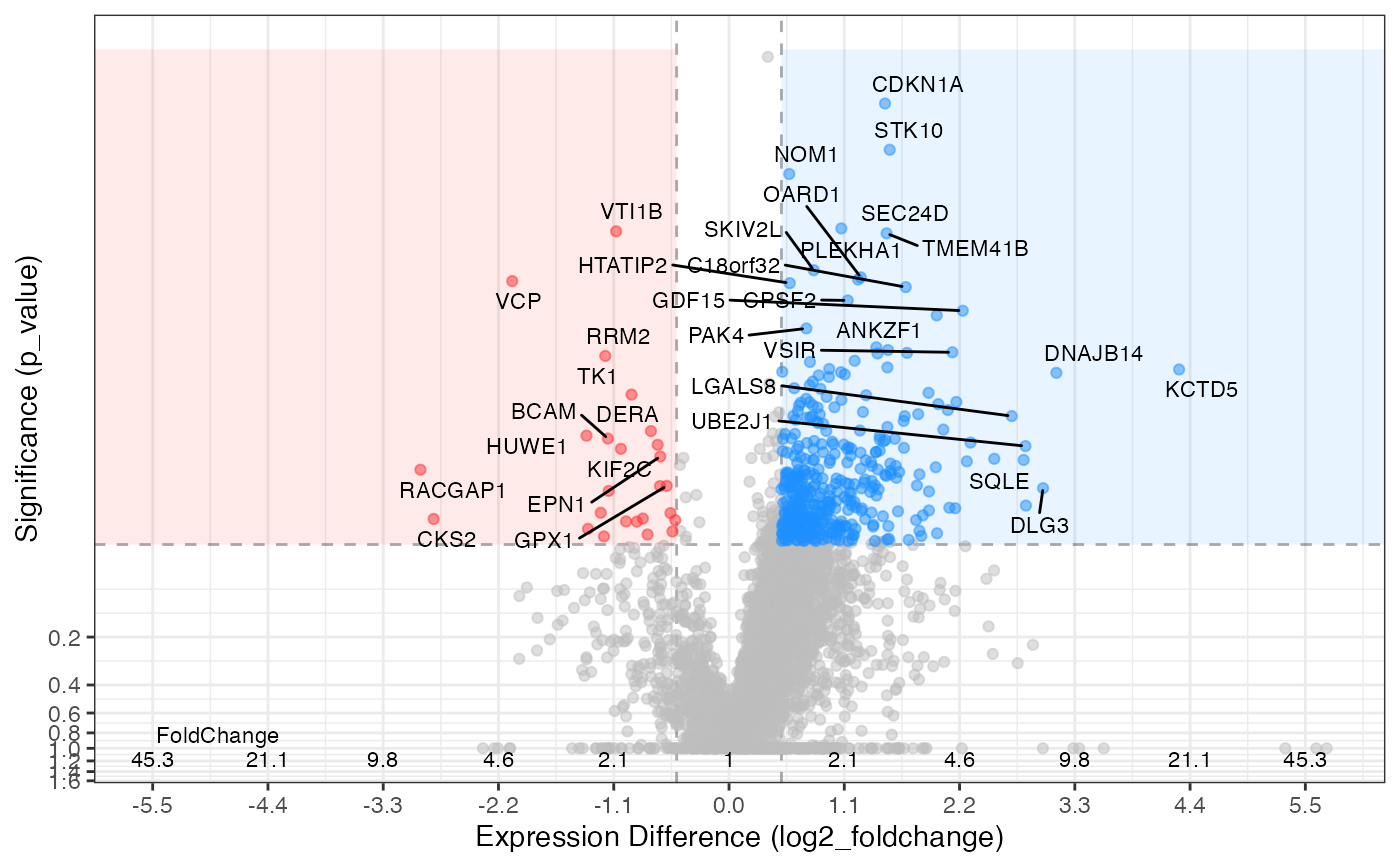
hela_proteins %>%
expression(knockdown/control) %>%
plot_volcano(knockdown/control, log2fc_min = 0.5, significance_column = "p_value", labels_column = "gene_name")
#> ℹ .. expression::t_test testing knockdown / control
#> ✔ .. expression::t_test testing knockdown / control [3.1s]
#>
#> [1] 8.884161e-05 4.994106e-02
#> Warning: Removed 13 rows containing missing values or values outside the scale range
#> (`geom_text_repel()`).
#> Warning: ggrepel: 368 unlabeled data points (too many overlaps). Consider increasing max.overlaps
# generates the same out come
# hela_proteins %>%
# expression(knockdown/control) %>%
# export_analysis(knockdown/control, .analysis = "expression") %>%
# plot_volcano(log2fc_min = 0.5, significance_column = "p_value")
# display the gene name instead
hela_proteins %>%
expression(knockdown/control) %>%
plot_volcano(knockdown/control, log2fc_min = 0.5, significance_column = "p_value", labels_column = "gene_name")
#> ℹ .. expression::t_test testing knockdown / control
#> ✔ .. expression::t_test testing knockdown / control [3.1s]
#>
#> [1] 8.884161e-05 4.994106e-02
#> Warning: Removed 13 rows containing missing values or values outside the scale range
#> (`geom_text_repel()`).
#> Warning: ggrepel: 368 unlabeled data points (too many overlaps). Consider increasing max.overlaps