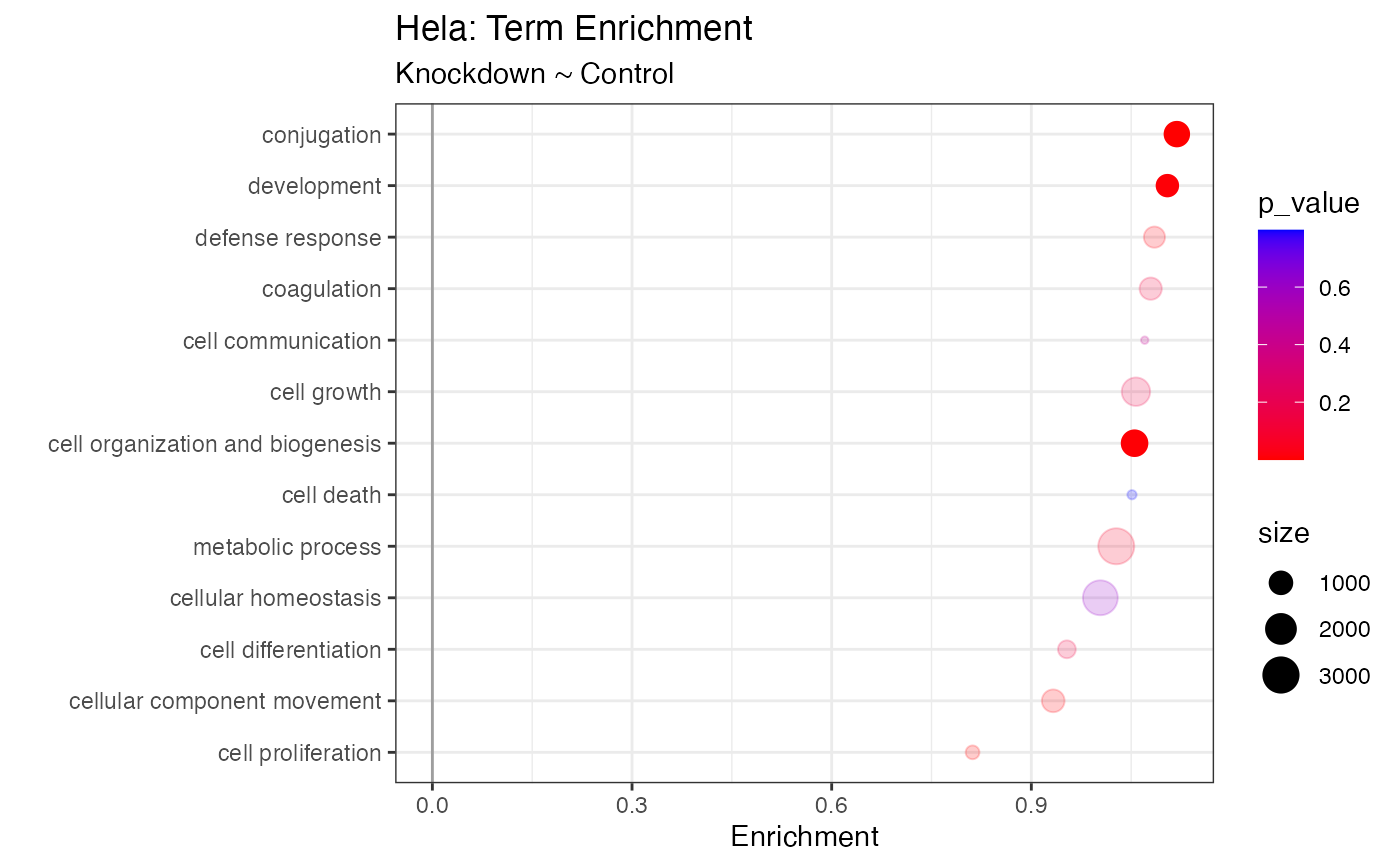
Bubble plot of enrichment values
plot_enrichment.Rdplot_enrichment() is a GGplot2 implementation for plotting the enrichment values. This function can
take either a tidyproteomics data object or a table with the required headers.
Usage
plot_enrichment(
  data = NULL,
  ...,
  .term = NULL,
  enrichment_min = 1,
  enrichment_column = "enrichment",
  significance_max = 0.01,
  significance_column = "p_value",
  term_column = "annotation",
  size_column = "size",
  destination = "plot",
  height = 5,
  width = 8
)
Arguments
- data
a tidyproteomics data object
- ...
two sample comparison
- .term
a character string indicating the term enrichment analysis should be calculated for
- enrichment_min
a numeric defining the minimum log2 enrichment to highlight.
- enrichment_column
a character defining the column name of enrichment values.
- significance_max
a numeric defining the maximum statistical significance to highlight.
- significance_column
a character defining the column name of the statistical significance values.
- term_column
a character defining the column name for labeling.
- size_column
a character defining the column name of term size.
- destination
a character string
- height
a numeric
- width
a numeric
Examples
library(dplyr, warn.conflicts = FALSE)
library(ggplot2, warn.conflicts = FALSE)
library(tidyproteomics)
hela_proteins %>%
   expression(knockdown/control, .method = stats::t.test) %>%
   enrichment(knockdown/control, .terms = 'biological_process', .method = "wilcoxon") %>%
   plot_enrichment(knockdown/control, .term = "biological_process") +
   labs(title = "Hela: Term Enrichment", subtitle = "Knockdown ~ Control")
#> ℹ .. expression::t_test testing knockdown / control
#> ✔ .. expression::t_test testing knockdown / control [3.4s]
#>
#> ℹ .. enrichment::wilcoxon testing knockdown / control by term biological_process
#> ℹ annotation other had issues, not reported
#> ℹ .. enrichment::wilcoxon testing knockdown / control by term biological_process

#> ✔ .. enrichment::wilcoxon testing knockdown / control by term biological_proces…
#>
